How can I access Global 2 data?
We are continuing to work on expanding the ways that WorldPop data can be openly accessed and used. A number of updates have been made to provide access to the Global 2 data, and we are working on expanding and improving these – this is a key focus of ongoing funding from the Wellcome Trust.
Geotiff format datasets for use in Geographical Information Systems (GIS) and beyond can be obtained through the WorldPop data catalog, as well as UN OCHA’s Humanitarian Data Exchange (HDX). Don’t worry if you still need to download the old Global 1 data – we’ve archived these for population counts here and age/sex structures here. We’re also working with ESRI and Google to make Global 2 data available in Living Atlas and Earth Engine, and you can already explore the new data through this Google Earth Engine App. The WorldPop Application Programming Interface (API) provides access to WorldPop data and has been updated for the Global 2 data.
There are also some new ways to access Global 2 data. We’ve developed a plugin for QGIS – see this video for more information. Finally, we’ve developed a Spatiotemporal Asset Catalog (STAC) API implementation for Global2 to simplify browsing, search and download of the data.
What do I need to be aware of when using Global2 data?
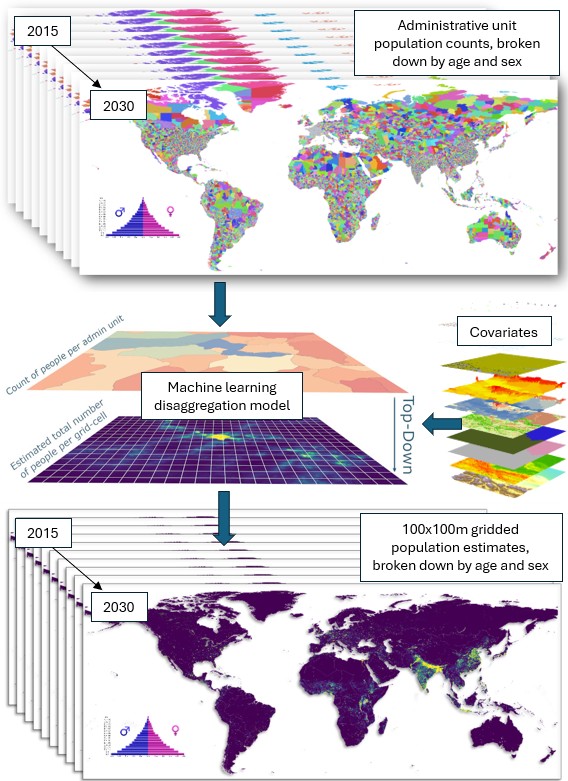
Estimating numbers of people, their demographic characteristics and changes over a 16-year period across the billions of 100x100m grid cells that cover the planet is no easy task! Constructing a multi-year time series of small area population estimates requires a range of input data decisions, methodological assumptions and trade-offs, producing output estimates that are likely to be less accurate than those built for just a single, recent time point or individual country. It is important to think about what you need small area population data for, and whether other datasets may be more appropriate – Global 2 data have a lot of limitations – this page is designed to help you.
We remain a relatively small team in the School of Geography and Environmental Science at the University of Southampton and cannot check and validate every area of the planet across multiple years, so rely on those of you who may be reading this to alert us to potential anomalies, errors and inconsistencies. You may have local knowledge or access to datasets that we were unable to include in our data production process. We are always grateful to hear about this, get your feedback and try our best to fix any issues with the estimates.
Some key assumptions, limitations and issues to be aware of:
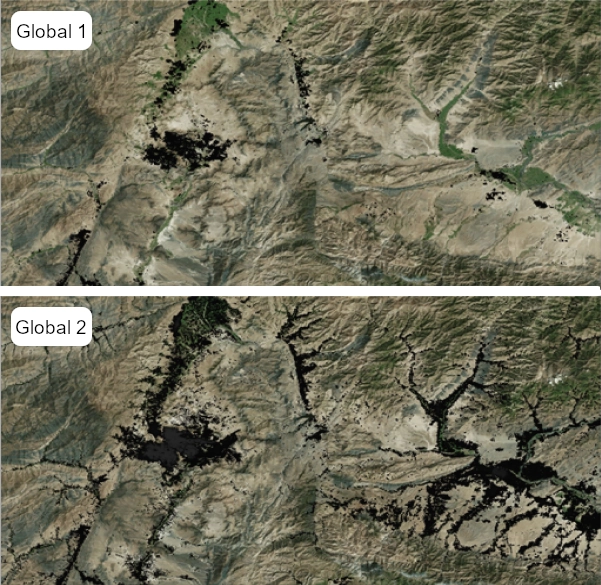
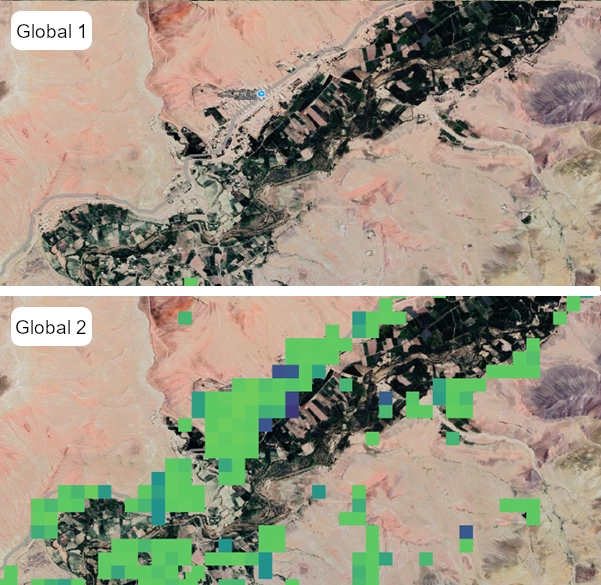
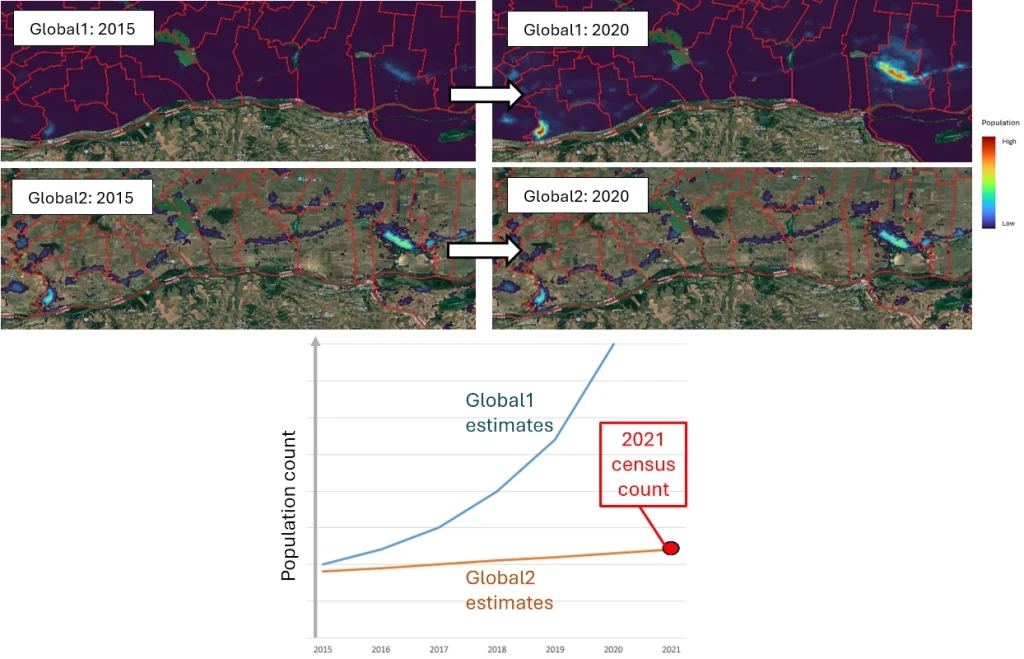
- The construction of a new and improved mastergrid means that there is a mis-alignment of grid squares between Global 1 and Global 2 that may impact comparisons or analyses that are being transferred to the new data.
- These data are ‘top-down’ model disaggregations of larger area counts, and so if these input counts are problematic, then so are our gridded estimates. For some countries where it has been many years since the last census and a lot has changed, you may want to consider our ‘bottom-up’ estimates as an alternative source of census-independent gridded estimates.
- The input census and estimate population data represent a global mosaic of data sources across geography and time. The substantial differences between countries in numbers of datasets, administrative unit levels, types of data and quality of data mean that output gridded estimates vary in accuracy between countries and years.
- Each country is modelled separately. Past work has shown that this is vital for capturing local relationships with covariates that are missed with global or regional models, which can be infeasible computationally anyway. This means trade-offs though, with some country models trained only on coarse input population data or uncertain estimates. The results can be inconsistencies between countries, with some showing better model fit statistics and capturing realistic ranges of population densities better than others.
- Across time, different demographic projection methods were used. For some countries where recent censuses have not been undertaken, or where census data were not available, published estimates from NSOs or UN agencies were used, and these bring substantial uncertainties with them. See the Global 2 release statement for details on these sources.
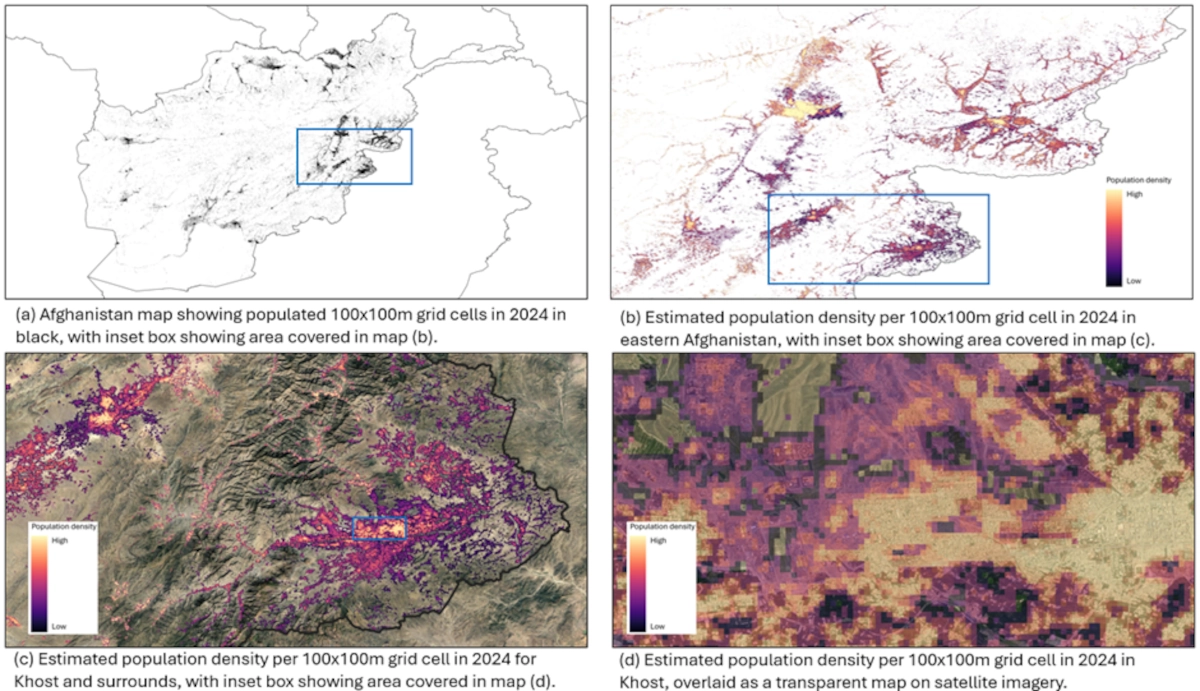
- Where population projections were made, it is expected that the uncertainty will increase for population datasets representing years further away from the input population dataset timepoints. This is also expected to be true for the built settlement growth model, in which several timepoints of input settlement data are interpolated.
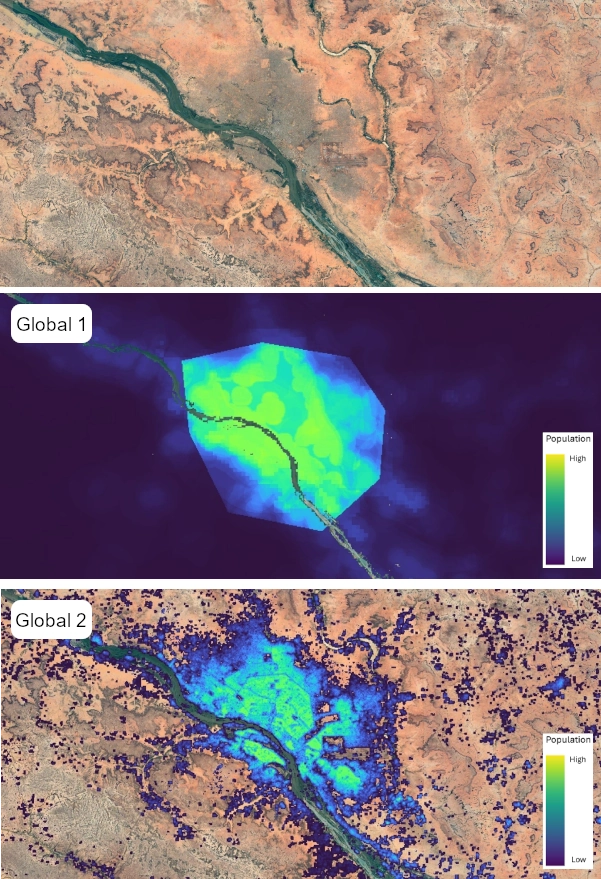
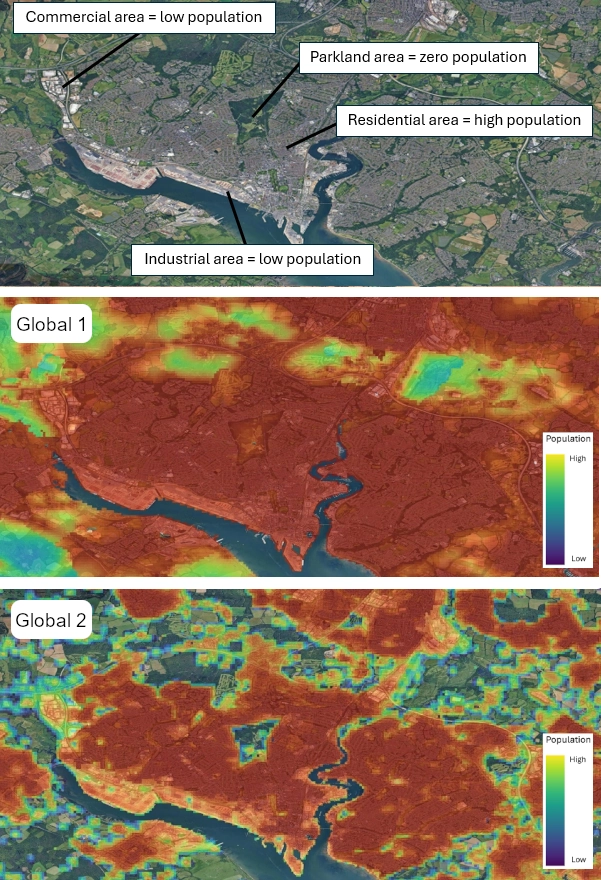
- We have tried where possible to get two timepoints of subnational census/projection datasets to better capture subnational patterns and trends of demographic change, rather than being reliant on the single timepoint extrapolations from the GPW4 database that led to many problems with Global 1 datasets. For some countries this has led to compromises, where less spatially-detailed population data than for Global 1 are used as input to enable capturing temporal trends. This can result in Global 2 output population maps looking less spatially detailed than Global 1 or not capturing high urban population densities well, but instead providing more reliable population totals and demographic breakdowns across broader subnational areas.
- For consistency, all datasets were produced using a fixed set of covariates that were available globally. Therefore, a limited selection of factors considered to be related to population distributions in each country have been considered. This represents a trade-off in the production of generalisable models, in which the accuracy of gridded population datasets for some countries could be improved by considering additional, locally specific factors.
- The census-based input population data may not have captured changes caused by rapid onset events responsible for sudden fluctuations of population numbers (e.g. forced displacements due to natural disasters or conflict). Likewise, our projections do not account for future rapid onset events or seasonal and intra-annual population mobility between administrative units.
- The Global 2 data are aligned to match the UN World Population Prospects 2024 edition estimates at the national scale, and these represent estimates themselves with their own uncertainties. If your preference is for alternative national totals (e.g. US Census Bureau, IHME, IIASA), then adjustments are straightforward to undertake – just get in contact with the WorldPop team to inquire.
What’s coming next?
Global 2 represents one component of WorldPop’s wider ongoing activities around improving spatial demographic methods and data, and their uptake and use. We have started with population counts, broken down by a set of age and sex classes at 100m and 1km resolution, but will make available additional datasets over the coming months. These will include administrative unit summaries, population density, additional age classes, degree of urbanisation breakdowns and integer versions, among others.
While we are here introducing the new Global 2 datasets, we’re aiming to transition to a more ‘live’ set of global population data products. As new censuses and surveys are conducted, new building maps released and new methods developed, we’re working towards these being more dynamically incorporated into outputs. So, look out for country updates – and Global 2.1, 2.2, etc.
Improving our abilities to more accurately estimate and map populations in the most remote rural and highest density urban settings is a primary research focus. Ongoing work on mapping slum areas, refugee and nomadic populations, and demographic dynamics using AI, geo-embeddings and other new digital datasets will feed into future outputs. Research is also ongoing on mapping future population scenarios following recent support from the Wellcome Trust to establish FuturePop.
Finally, ensuring that methods and datasets can be accessed, understood, adopted and used by decision makers remains a priority. Co-development of country and application-specific small area population estimates is ongoing with national statistical offices, ministries of health and UN agencies around the World. A key component of this is capacity strengthening, and our new training manual and book of methods are now online, with more materials to be added soon. We’re also developing an online WorldPop community of practice, refreshing our demographic portal and are adapting AI large language models to construct a WorldPop AI assistant, enabling simple natural language queries of the data in multiple languages.
Acknowledgements
Global 2 has involved many people and organisations over the past few years. We would like to recognise all the hard work put in my so many across the WorldPop team in the School of Geography and Environmental Science at the University of Southampton, as well as our colleagues in Social Statistics and Demography. The WorldPop portfolio management and operations team have undertaken fantastic work in setting up and running the project work, while Southampton’s iSolutions team who run the Iridis high performance computing cluster have been vital in constructing the new data. Global 2 also represents a wider collaboration, including researchers at the Università degli Studi di Milano Statale in Italy, Jade University in Germany and Columbia University in the US. We are also grateful to the support of staff from the UN Population Division and Google Research for sharing data and feedback, and to those from UN-OCHA’s HDX for hosting and promoting the new data. We are also thankful to those who gave extensive feedback during our Beta testing phase, including those from UNICEF and the UN Convention to Combat Desertification. Finally, we thank the Gates Foundation for their support throughout the production of Global 2.