Top-down estimation modelling: Constrained vs Unconstrained
As described on the Mapping Populations page, population and housing censuses remain the most important resource for production of accurate population data at national and subnational scales. Typically only made available as counts per administrative unit however, these mask small area variations and are challenging to integrate with other datasets. WorldPop top-down modelling methods take a global database of administrative unit-based census and projection counts for each year 2015-2030 and utilise a set of detailed geospatial datasets to disaggregate them to grid cell-based counts. Two methods have been adopted to produce these over multiple countries using Random Forests machine learning methods described in Stevens et al, with code available here. 1. Estimation over all land grid squares globally (unconstrained), and 2. estimation only within areas mapped as containing built settlements (constrained). Recent comparisons of constrained vs unconstrained top-down mapping across multiple countries in Reed et al and Stevens et al found limited differences in the accuracy of national maps produced by each, but variations by country were seen.
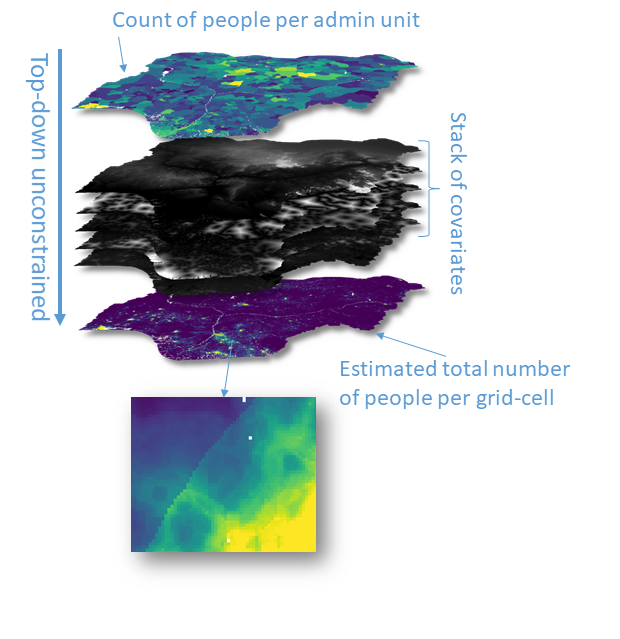
Top-down unconstrained
The unconstrained estimation modelling approach has been developed, refined and tested over the past 5 years, and implemented to produce global multi-temporal 100x100m age/sex structured datasets for each year 2015-2030. The assumption is made that no settlement dataset is accurate enough to identify all residential settlements/buildings globally and therefore be used as a mask over the 2015-2030 period to map uninhabited areas. The modelling is therefore ‘unconstrained’, making predictions about population numbers for all 100x100m land grid cells globally for each year 2015-2030 through disaggregating the administrative unit-based census and projection database. Further details on the approach and comparisons to other modelling methods can be found in Stevens et al, Sorichetta et al and Gaughan et al. The datasets are suitable where the accuracy of the satellite-based mapping of settlements is uncertain, especially in the detection of small rural settlements. However, recent improvements in the mapping of settlements and buildings from satellite imagery using AI mean that the constrained estimates are likely to be more accurate for most settings. The age, resolution and accuracy of input census/projection data should be considered, with bottom-up models likely more suitable and accurate for some countries. See this page for advice on dataset choices.
Advantages:
- Not as sensitive to the accuracy of building/settlement mapping as the constrained modelling
- Multi-temporal global data available for each year 2015-2030
Disadvantages:
- Method produces a non-zero allocation of population to all land grid cells, resulting in misallocation of population to uninhabited areas, and under-estimates of urban populations in some areas.
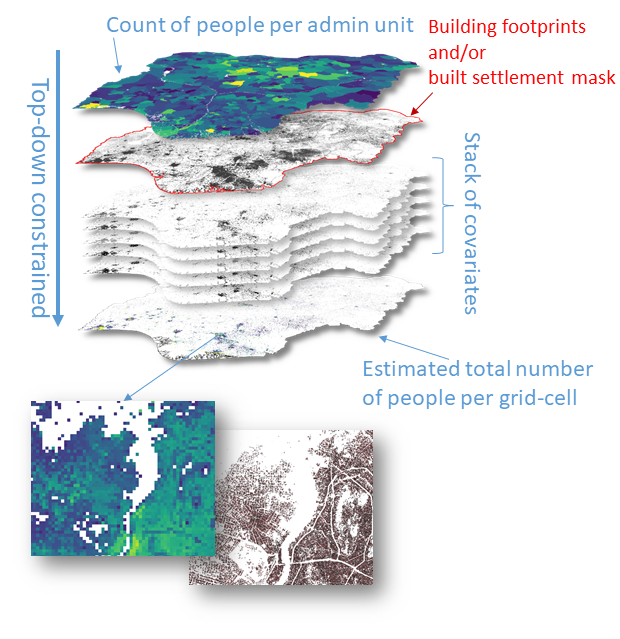
Top-down constrained
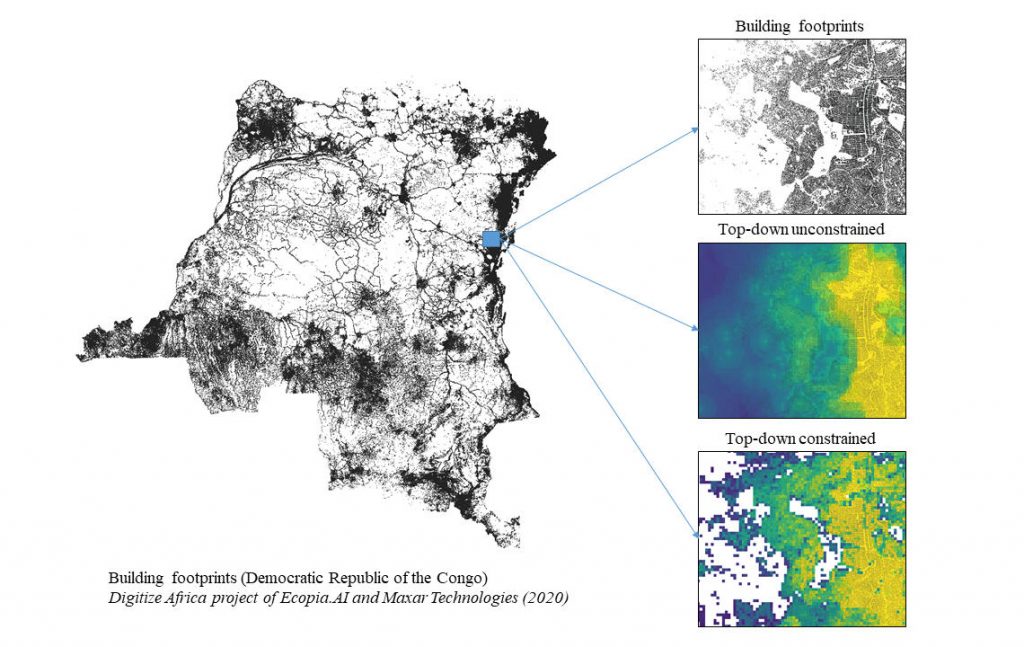
The mapping of human settlements and the buildings that they consist of from satellite imagery is continuing to improve in spatial detail, accuracy and availability. Previously, small settlements and isolated buildings were consistently missed, making such datasets a poor basis for defining the absence of residential populations. Recent refinements however are now making feasible their use as a mask to identify uninhabited areas over recent time periods. WorldPop’s top-down constrained estimation modelling uses satellite-derived building footprint data from Maxar/Ecopia, Google and Microsoft, together with settlement maps from GHSL and WSF, within a built settlement growth model to map settlements for each year 2015-2030. Random Forests based modelling (Stevens et al) is then applied to disaggregate population to only those grid cells identified as containing residential buildings/built settlement, with building classifications derived from GHSL and OSM. These population datasets are most suitable where accurate identification of rural populations and uninhabited areas is a priority. However, the age, resolution and accuracy of input census/projection data should be considered, with bottom-up models likely more suitable and accurate for some countries. See this page for advice on dataset choices.
Advantages:
- Where settlement/buildings are accurately mapped, the outputs present a more accurate population distribution, without small population numbers predicted in likely uninhabited areas.
Disadvantages:
- Reliant on the accuracy of satellite-based settlement and building mapping.
- Where settlements/buildings are missed, this can lead to over-allocation of population to neighbouring settlements. Conversely, where settlements/buildings are incorrectly identified, under-allocation of population to neighbouring settlements can occur.
Comparison of top-down unconstrained vs constrained population mapping