
WorldPop gridded population estimate datasets and tools. How are they different and which should I use?
How are they different and which should I use?
Gridded population estimates are particularly useful as they provide decision-makers and data users with the flexibility to aggregate population estimates into different spatial units in existing enumeration areas or custom areas. They can be aggregated over various levels of administrative units, but also over areal units that don’t follow administrative boundaries, such as a hospital catchment area, enabling integration and analyses with a range of other spatial datasets that are not possible using standard census counts mapped to administrative boundaries. The modelled datasets do not however replace the need for a full census, which usually includes a more precise collection of demographics and socioeconomics, as well as a housing census.
WorldPop produces a range of different gridded population estimate datasets and tools, and choosing the best to use depends on your needs and situation. Here is a video (using examples from Global 1 data (2018)) to provide more background on the different WorldPop gridded population datasets and tools to help you decide. In brief, here are some questions to consider:
- Are you interested in a specific country where it has either been many years since the last census and simple projections from this baseline may be highly uncertain, or the most recent census did not cover the entire country due to inaccessibility/insecurity?
- Are you interested in global/continental coverage and/or changing population numbers over time?
- Do you need population totals to match census counts, official projections or UN estimates at national or sub-national scales?
If your answer to any questions in the red box were yes, then it is likely that our ‘top-down’ datasets are best for you. If you answered yes to the question in the blue box, then our set of ‘bottom-up’ datasets may make sense for you. Moreover, if you have access to new population estimates or survey data and want to experiment with using them to create your own simple and rapid gridded datasets, then you may want to consider our rapid population mapping tools.
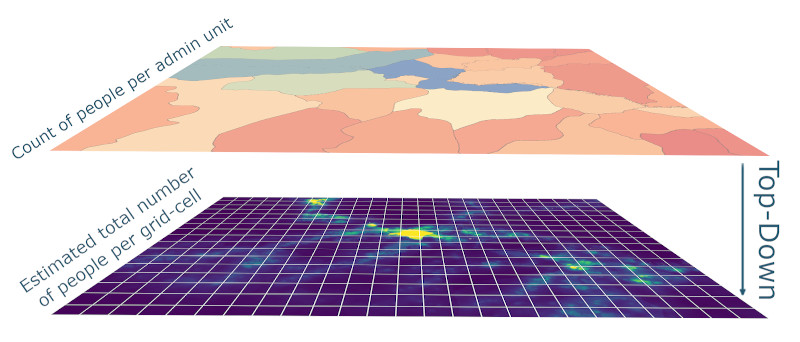
Top-down datasets
Population and housing censuses are the most important resource to produce accurate population data at the national and sub-national level. These are typically undertaken every decade and simple projections can be used to create subnational estimates in the intervening years. These data are typically only available as counts per administrative unit though, masking small area variations and making them difficult to integrate with other datasets. WorldPop top-down modelling methods take a global database of administrative unit-based census and projection counts for each year 2015-2030 and utilise a set of detailed geospatial datasets to disaggregate them to counts for each 100x100m or 1x1km grid cell classified as settled by humans.
Advantages:
- Consistent and complete estimates for each year 2015-2030 for every country, including breakdowns by age and sex
- Maintains the ‘official’ population estimates or census counts at the administrative unit level of the input data, as well as adjustments available to match UN national estimates
Disadvantages:
- For countries that have not had a census for a long time and/or where significant subnational variations in migration, fertility and mortality exist, the input ‘official’ population counts and projections based on them can be highly uncertain
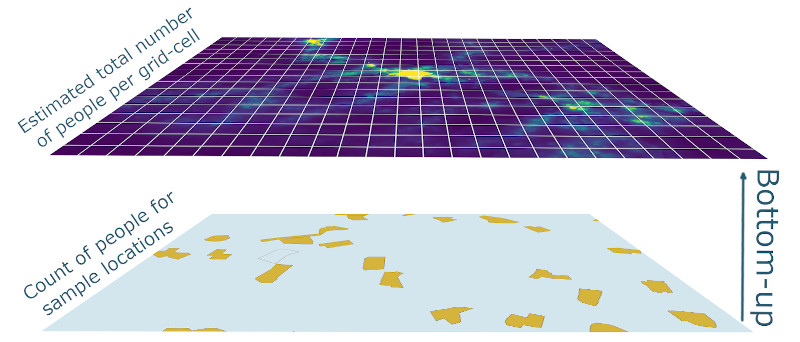
Bottom-up datasets
Where little recent population enumeration data exist for a country and timely estimates that account for recent demographic changes are required, the bottom-up approach is likely to provide more accurate estimates. Here, sample data from as many trustworthy and recent survey datasets as possible are used with detailed geospatial datasets to build a statistical model to estimate population numbers and age/sex breakdowns in unsampled locations, together with measurements of uncertainty. This approach can also be used to fill gaps in a census where full enumeration is not possible due to conflict, poor access or financial limitations.
Advantages:
- More accurate outputs than top-down approaches where census data are outdated and/or census projections from these are highly uncertain
- Measurement and mapping of uncertainty highlights where caution in using the data should be exercised and where further data collection could be prioritised
Disadvantages:
- Tailored modelling to the country of interest takes effort and often engagement with governments, which can be slow
- Typically estimates are tied to a single year