The novel SARS-CoV-2 variants have raised serious concerns about a new wave of the pandemic and the effectiveness of vaccines, particularly concerning the recent surge of cases in India caused by a new ‘variant of concern’ (lineage B.1.617). This new strain was first detected in India and among international cases with travel history from India. To explore the main destinations of international travellers departing from (and to) India before travel bans implemented by many countries in 2021, this report used de-identified and aggregated mobility data produced for the Disease Prevention Maps tools by the Facebook Data for Good Program (https://dataforgood.fb.com/tools/disease-prevention-maps/), and international population movement data derived from geotagged tweets by the ODT Flow Explorer (http://gis.cas.sc.edu/GeoAnalytics/od.html), for preliminarily assessing the spread risk of the new variant, lineage B.1.617, from India to other regions during the period from late 2020 to early 2021.
It is important to note that the biases within these geolocation data obtained from smartphone/Apps/social media are not well characterised and that they likely skew towards different geographies, user groups and richer and younger populations. Children, the elderly and the poorest are likely to be not well represented. The characteristics and potential biases of the Twitter-derived travel flows can be found in our previous report (www.worldpop.org/events/covid_variants). Ongoing work within WorldPop is focussed on comparisons of multiple datasets to better understand and quantify such biases.
Given limited capacities in diagnosis and healthcare in many countries and the small fraction of infections that have been sequenced, the new variant could already be in other countries without having been detected. We are closely monitoring the rapidly changing situation, and further analyses will be conducted to update analyses on the risk of international spread and onward transmission of new SARS-CoV-2 variants via population movements.
More details about WorldPop’s COVID-19 studies and datasets for supporting the global response to the ongoing pandemic can be found at: www.worldpop.org/covid19.
Acknowledgements
We acknowledge the efforts of the Facebook Data for Good Program team and the ODT Flow Explorer team in deriving the mobility data. We also acknowledge the support of the wider WorldPop team in the production of these initial outputs, and the efforts of the researchers that are part of the cov-lineages.org team in generating and making available data on new strains.
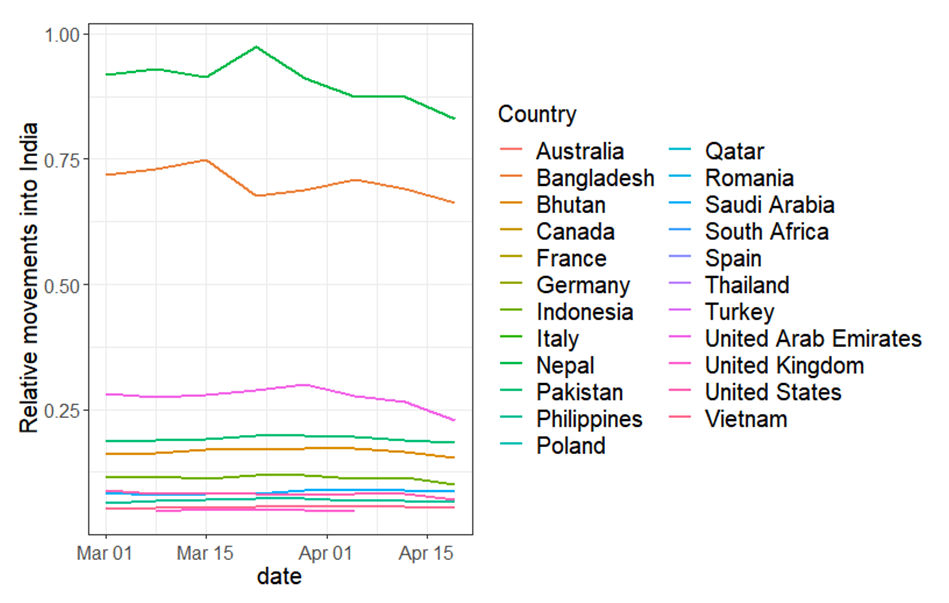
Figure 1. Relative movements into India since March 1, 2021, based on mobility data produced by the Facebook Data for Good Program. Only countries with >1000 Facebook users moving per day were included.
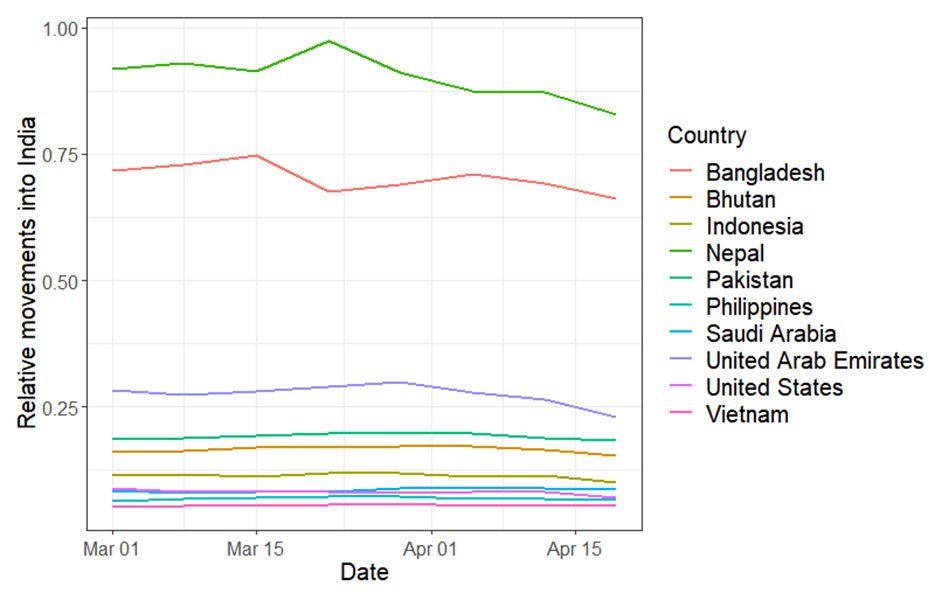
Figure 2. Relative movements into India for the top ten countries with most movements since March 1, 2021, based on mobility data produced by the Facebook Data for Good Program. Only countries with >1000 Facebook users moving per day were included.
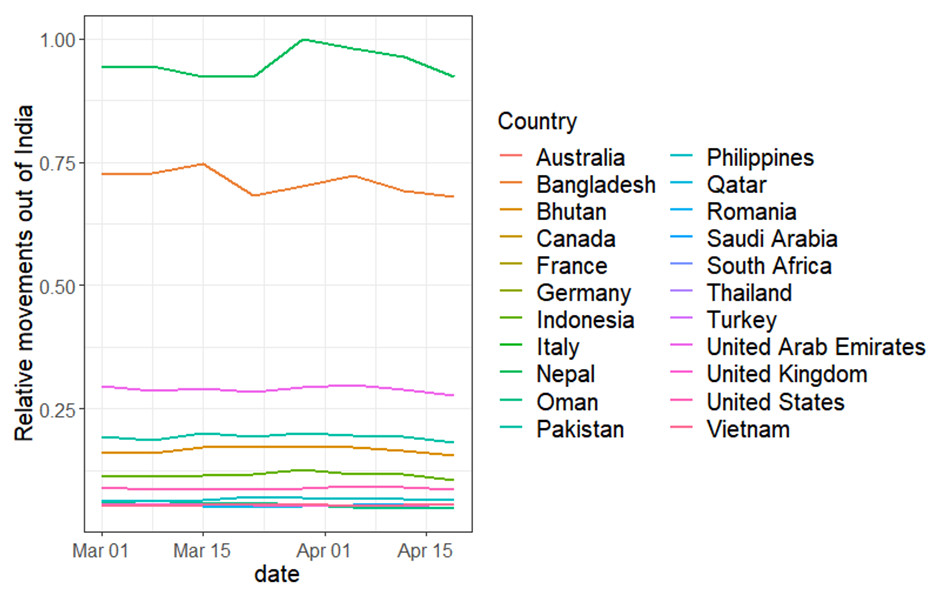
Figure 3. Relative movements out of India since March 1, 2021, based on mobility data produced by the Facebook Data for Good Program. Only countries with >1000 Facebook users moving per day were included.
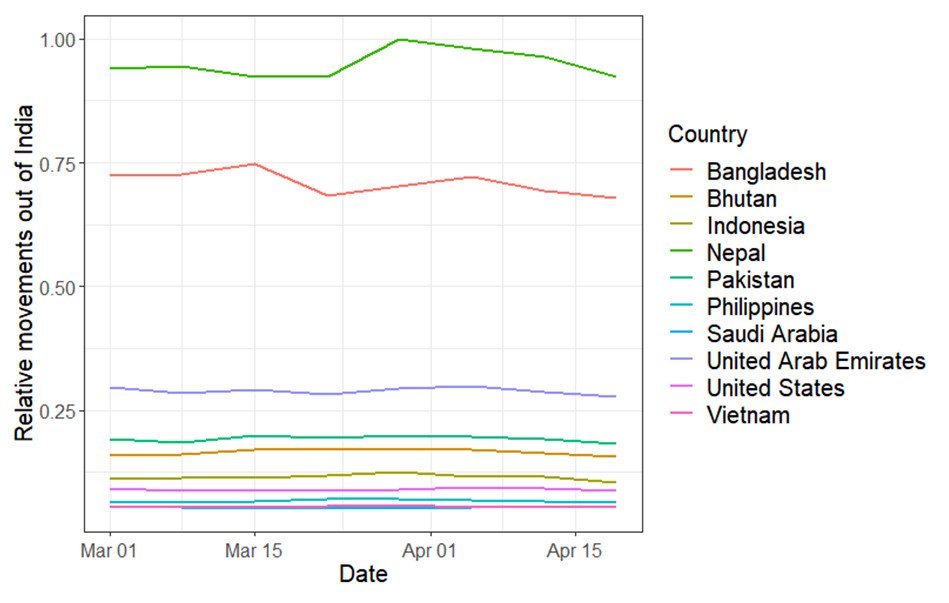
Figure 4. Relative movements out of India for the top ten countries with most movements since March 1, 2021, based on mobility data produced by the Facebook Data for Good Program. Only countries with >1000 Facebook users moving per day were included.
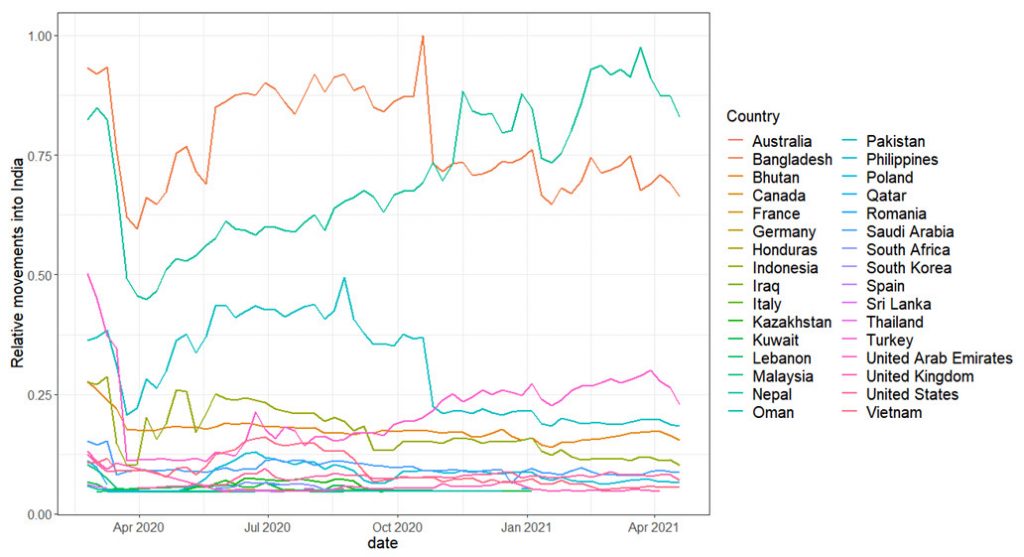
Figure 5. Relative movements into India over the past year, based on mobility data produced by the Facebook Data for Good Program. Only countries with >1000 Facebook users moving per day were included.
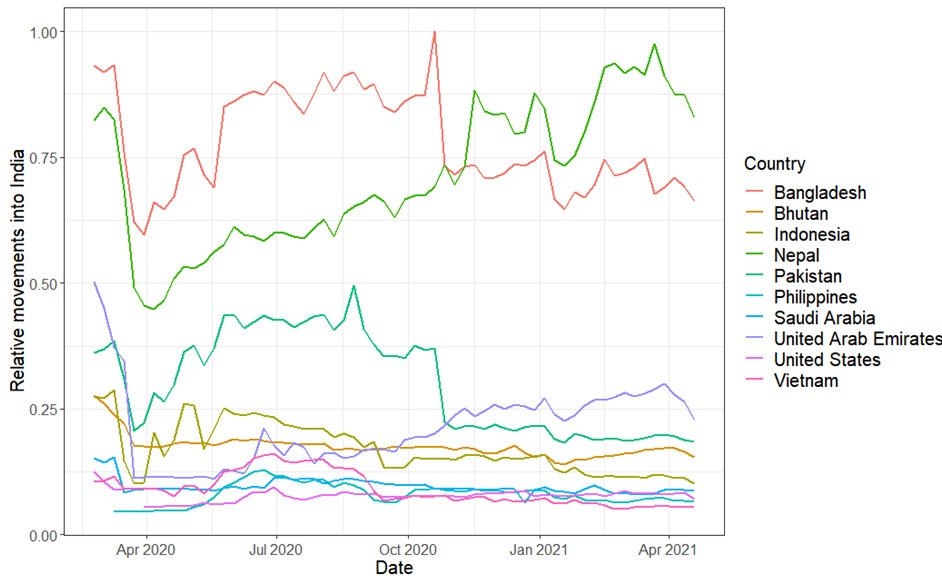
Figure 6. Relative movements into India for the top ten countries with most movements over the past year, based on mobility data produced by the Facebook Data for Good Program. Only countries with >1000 Facebook users moving per day were included
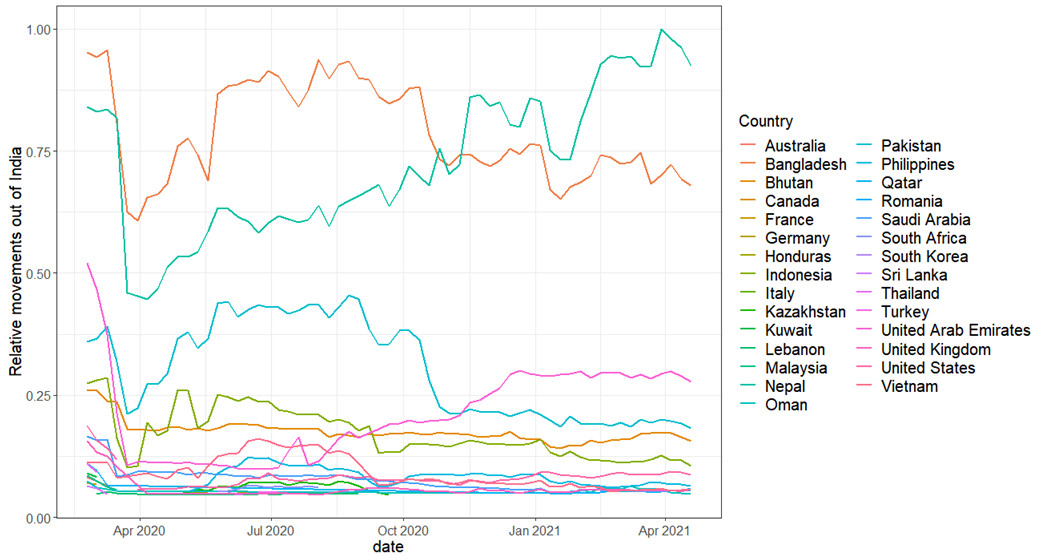
Figure 7. Relative movements out of India over the past year, based on mobility data produced by the Facebook Data for Good Program. Only countries with >1000 Facebook users moving per day were included.
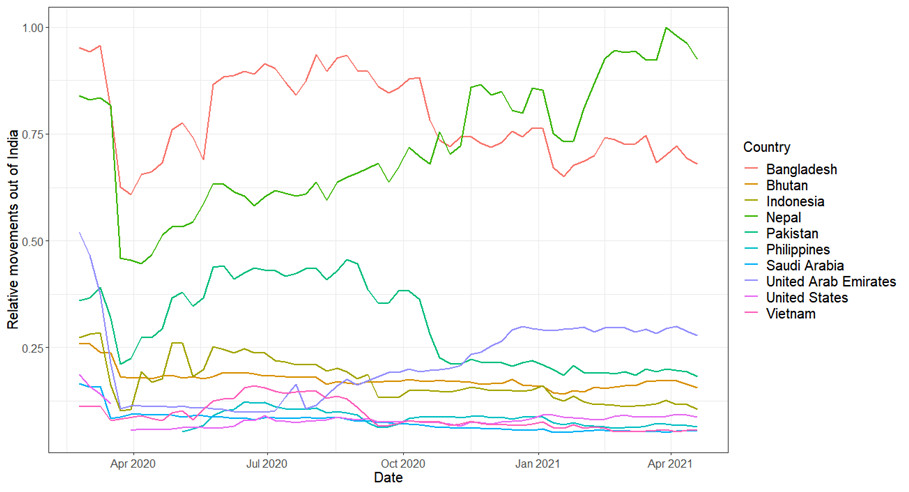
Figure 8. Relative movements out of India for the top ten countries with most movements over the past year, based on mobility data produced by the Facebook Data for Good Program. Only countries with >1000 Facebook users moving per day were included.
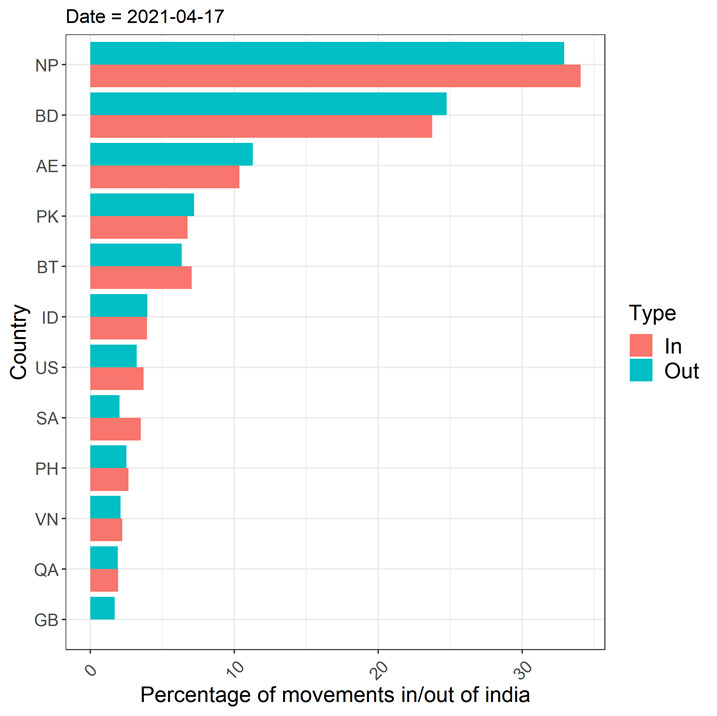
Figure 9. Example output for an individual day (April 17, 2021): Relative movements in/out of India. Only countries with >1000 Facebook users moving per day were included.
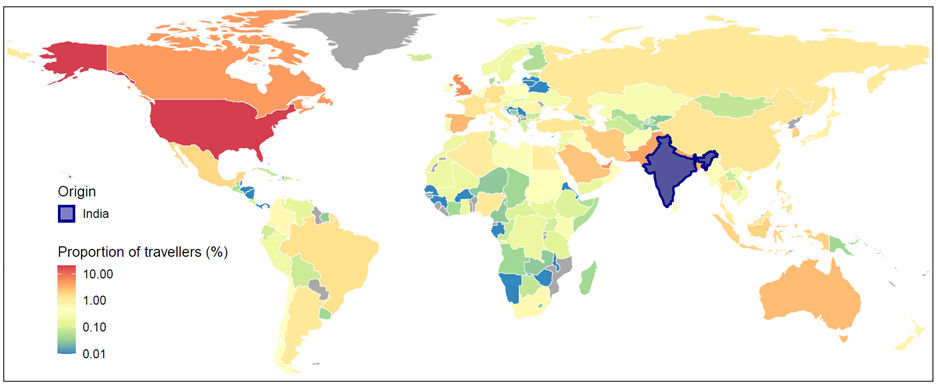
Figure 10. Main destinations of international travellers departing from the India in October – December 2020 as estimated based on geotagged Twitter data. The data are derived from the ODT Flow Explorer (http://gis.cas.sc.edu/GeoAnalytics/od.html). The areas with no data are filled in grey.
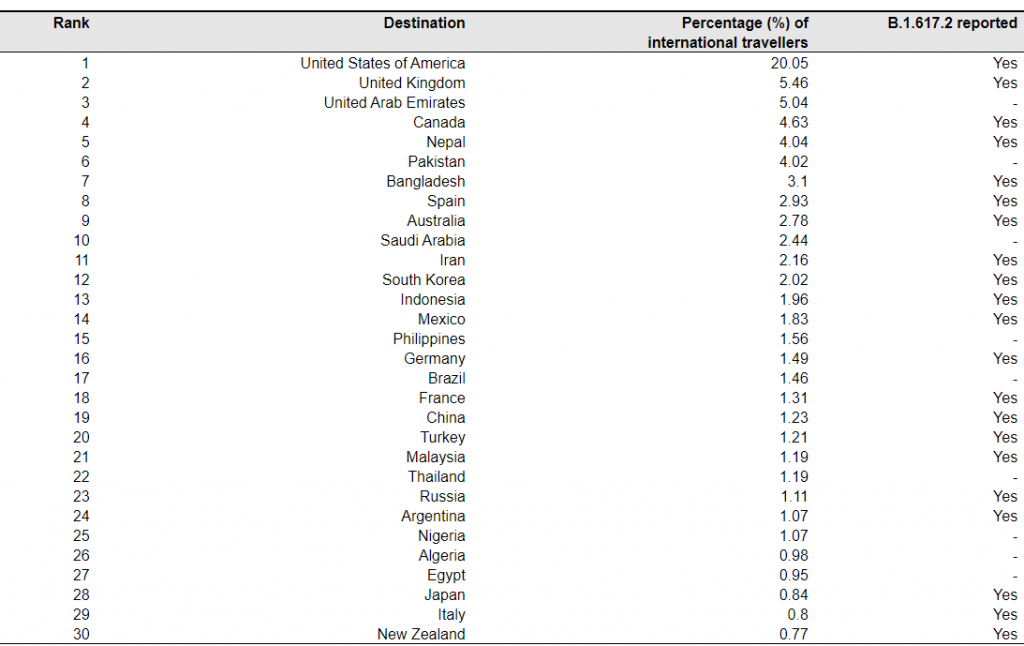
Table 1. Top 30 ranked countries or regions estimated to be receiving international travellers from India in October – December 2020, based on geotagged Twitter data.
Note: The mobility data are based on the population movement flows of geotagged Tweets derived from the ODT Flow Explorer (http://gis.cas.sc.edu/GeoAnalytics/od.html). The records of B.1.617.2 sequences in GISAID are based on the report published at https://cov-lineages.org/, as of May 26, 2021.