Preliminary risk analysis of the international spread of new COVID-19 variants, lineage B.1.1.7, B.1.351 and P.1
Shengjie Lai, Jessica Floyd, Andrew Tatem
WorldPop, School of Geography and Environmental Science, University of Southampton, UK
Email: Shengjie.Lai@soton.ac.uk; or A.J.Tatem@soton.ac.uk
The novel SARS-CoV-2 variants have raised serious concerns about a new wave of the pandemic and the effectiveness of vaccines, particularly concerning the recent new strains (lineages B.1.1.7, B.1.351, and P.1) found in the UK, South Africa, and Brazil [1-3]. We used de-identified and aggregated worldwide population movement data from billions of geotagged tweets and SafeGraph data from October – December 2020, derived using the ODT Flow Explorer [4], to explore the main destinations of international travellers departing from the UK, South Africa, and Brazil into other regions, and to assess the risk of new variants spreading across the World during the period from late 2020 to early 2021. It is important to note that the biases within these data in different countries are not well characterised and that they likely skew towards richer and younger populations, with children, the elderly and the poorest not well represented (see Appendix). Ongoing work within WorldPop is focussed on comparisons of multiple datasets to better understand and quantify such biases.
Spread of lineage B.1.1.7
A new variant B.1.1.7 of SARS-CoV-2, also designated a Variant of Concern (VOC) 202012/01 by Public Health England, was detected in November 2020 and is thought to have originated in the south-east of England in September or earlier [5]. It is estimated that the new strain increases the reproduction number by 56% (95% credible interval 50-74%) over previous strains of SARS-CoV-2 [6-8]. The new variant has increased infectiousness across all age groups, not just among the younger population, with a surge of cases across the UK being seen [6, 7]. This new lineage might also be associated with an increase in mortality [9], but more evidence is needed to confirm that this variant would result in greater or lesser severity of disease than pre-existing variants.
Since mid-December 2020, restrictions have been placed by many countries across the globe on incoming travel from the UK to slow down the pace of this variant spreading. However, previous travel before the restrictions were implemented, as well as the high prevalence of this variant among current UK infections, may well have seeded the virus internationally [10]. As of February 23, 2021, a total of 93 countries, territories or areas have identified infections with the variant (Figure 1) [11]. Most were found in travellers returning from the UK, which coincides strongly with the main destinations of international travellers from the UK, in October – December 2020 (Figure 2 and Table 1). For the time being, multiple countries in Europe, America, and East Asia have reported local cases of this new variant [11].
Spread of lineage B.1.351
On December 18, 2020, the South African government announced that it had seen the emergence of a new strain, known as 501.V2 or lineage B.1.351, sharing one of the mutations seen in B.1.1.7 found in the UK [12]. This variant was first identified in Nelson Mandela Bay, South Africa, in samples dating back to the beginning of October 2020, and cases have since been detected outside of South Africa [10]. This variant also has the N501Y mutation and several other mutations, but emerged completely independently of the UK strain and is not related to it. It has been found in up to 90 percent of the samples whose genetic sequences have been analysed in South Africa since mid-November. As of February 23, 2020, a total of 46 countries, territories or areas have reported the variant [13], and multiple countries in southern and eastern Africa, Europe, and North America have reported local transmission (Figure 3 and Table 2).
Spread of lineage P.1
An emerging SARS-CoV-2 lineage, P.1, was detected in Manaus, Amazonas state, northern Brazil in December 2020 [14]. This new variant is an alias of lineage B.1.1.28.1 and contains a unique constellation of lineage defining mutations such as E484K, K417T, and N501Y with biological importance [15]. The P.1. and B.1.1.7 lineages share the spike N501Y mutation, while the P.1. and B.1.351 lineages share three mutation positions in common in the spike protein (K417N/T, E484K, N501Y) [15]. It was identified in 42% (13 out of 31) RT-PCR positive samples collected during 15 – 23 December 2020, indicating local transmission and possibly recent increases in the frequency of a new lineage from the Amazon region [3, 14]. According to the recent international mobility data, the main destinations of international travellers leaving Brazil were the USA, Argentina, Paraguay, Uruguay, France, Mexico, and the UK (Figure 4 and Table 3). As of February 23, 2020, a total of 22 countries, territories or areas have recorded this new variant, but only Brazil, Belgium, Colombia, and Mexico reported local transmission [16, 17].
Given limited capacities in diagnosis and healthcare in many countries and the small fraction of infections that have been sequenced, the new variants could already be in other countries without having been detected. We are closely monitoring the rapidly changing situation, and further analyses will be conducted to update analyses on the risk of international spread and onward transmission of these new strains.
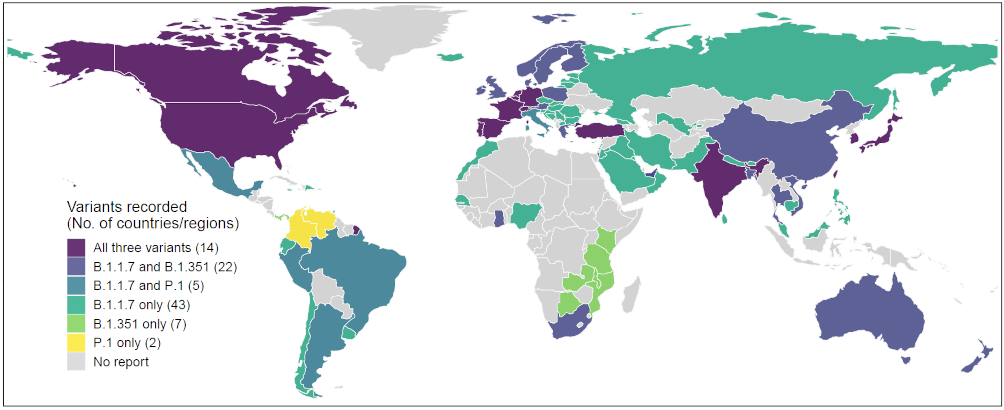
Figure 1. Reports of new SARS-CoV-2 variants, lineage B.1.1.7, B.1.351 and P.1, across different countries, territories or areas, as of 23 February 2021. The global records of new variants mapped here are based on the reports published at https://cov-lineages.org/ [11, 13, 16].
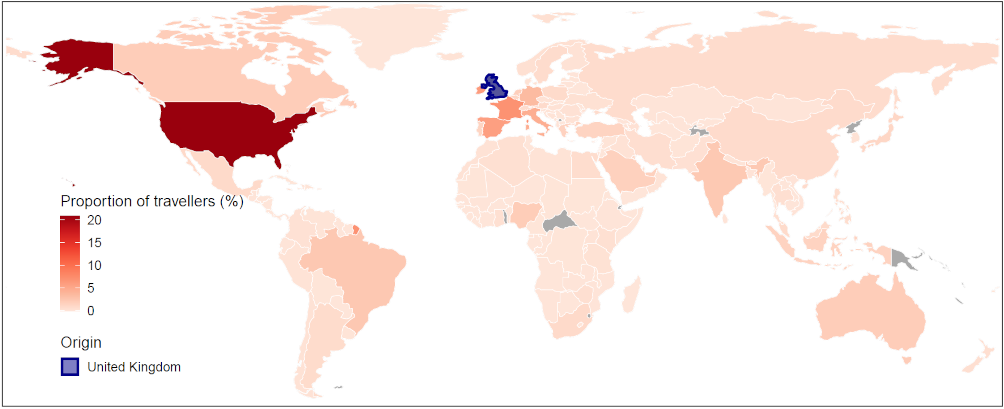
Figure 2. Main destinations of international travellers departing from the UK in October – December 2020. The mobility data are based on the population movement flows derived by the ODT Flow Explorer [4]. The areas with no data are filled in grey.
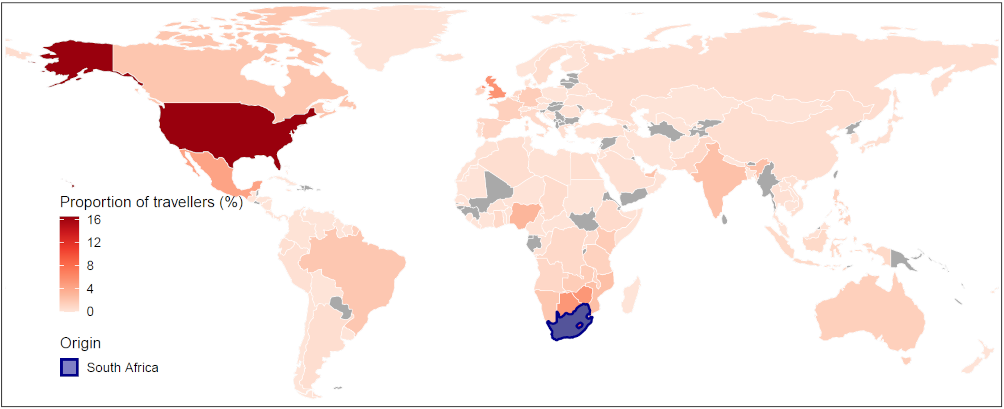
Figure 3. Main destinations of international travellers departing from South Africa in October – December 2020. The mobility data are based on the population movement flows derived by the ODT Flow Explorer [4]. The areas with no data are filled in grey.
Figure 4. Main destinations of international travellers departing from Brazil in October – December 2020. The mobility data are based on the population movement flows derived by the ODT Flow Explorer [4]. The areas with no data are filled in grey.
Table 1. Top 30 ranked countries or regions receiving international travellers from the UK in October – December 2020.
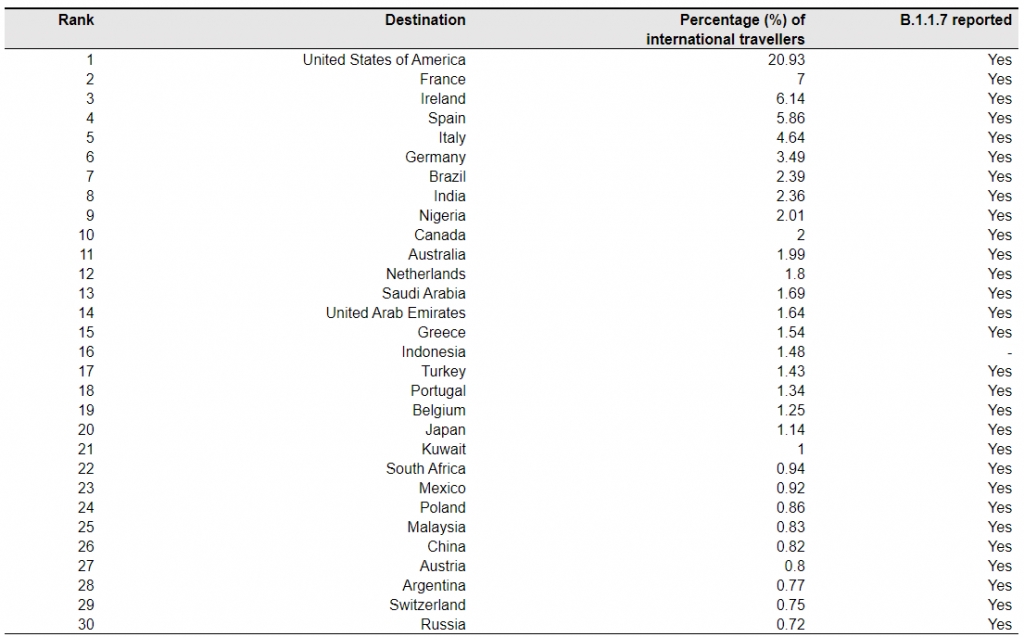
Note: The mobility data are based on the population movement flows derived by the ODT Flow Explorer [4]. The records of B.1.1.7 are based on the reports published at https://cov-lineages.org/, as of February 23, 2020 [11].
Table 2. Top 30 ranked countries or regions receiving international travellers from South Africa in October – December 2020.
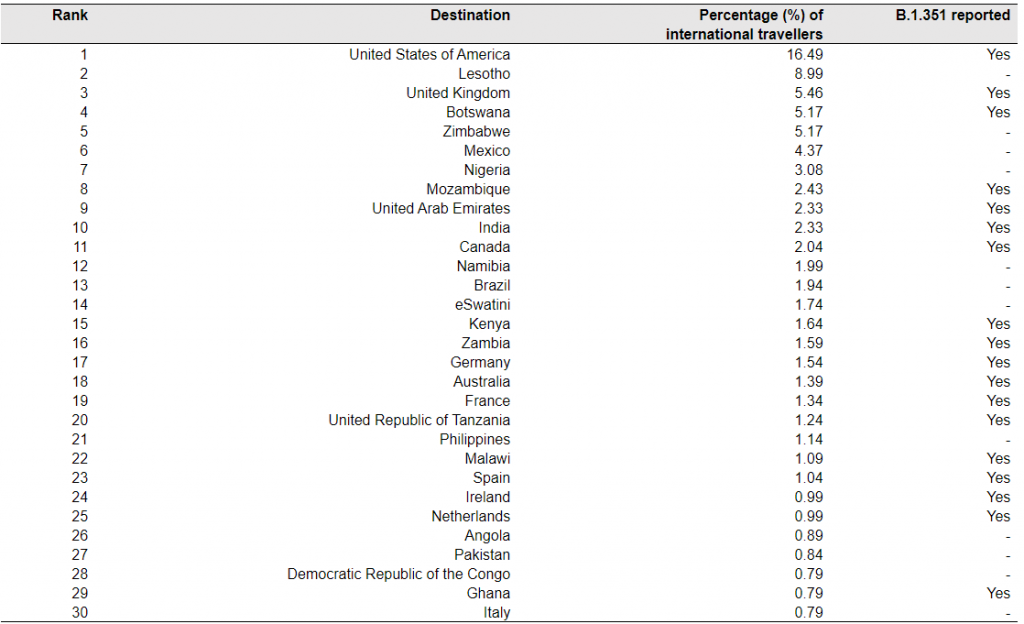
Note: The mobility data are based on the population movement flows derived by the ODT Flow Explorer [4]. The records of B.1.351 are based on the reports published at https://cov-lineages.org/, as of February 23, 2020 [13].
Table 3. Top 30 ranked countries or regions receiving international travellers from Brazil in October – December 2020.
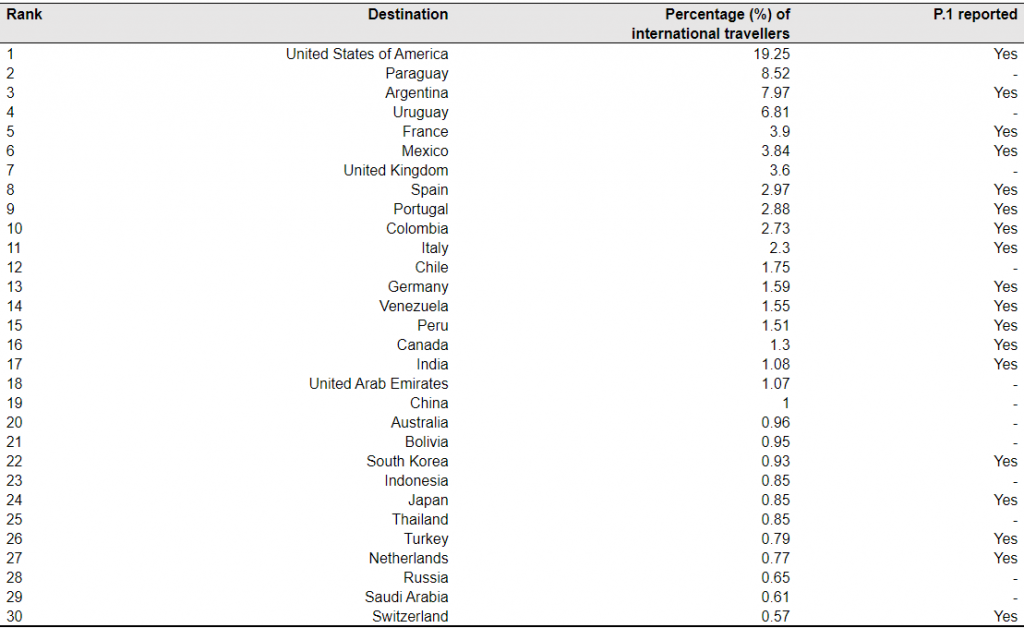
Note: The mobility data are based on the population movement flows derived by the ODT Flow Explorer [4]. The records of P.1 were based on the reports published at https://cov-lineages.org/, as of February 23, 2020 [16].
Acknowledgements
We acknowledge the efforts of the researchers that are part of the cov-lineages.org team in generating and assembling the data on new strains, and researchers from the ODT Flow Explorer in deriving the openly available mobility data. We also acknowledge the support of the wider WorldPop team in the production of these initial outputs.
Reference
1. Kupferschmidt K: Viral mutations may cause another very, very bad COVID-19 wave, scientists warn. Science 2021.
2. SARS-CoV-2 Variant United Kingdom of Great Britain and Northern Ireland [https://www.who.int/csr/don/21-december-2020-sars-cov2-variant-united-kingdom/en/]
3. Emerging SARS-CoV-2 Variants [https://www.cdc.gov/coronavirus/2019-ncov/more/science-and-research/scientific-brief-emerging-variants.html]
4. Li Z, et al: ODT Flow Explorer: Extract, Query, and Visualize Human Mobility. arXiv 2020:2011.12958.
5. Investigation of novel SARS-CoV-2 variant: Variant of Concern 202012/01 [https://www.gov.uk/government/publications/investigation-of-novel-sars-cov-2-variant-variant-of-concern-20201201]
6. Davies NG, et al: Estimated transmissibility and severity of novel SARS-CoV-2 Variant of Concern 202012/01 in England. medRxiv 2020:2020.2012.2024.20248822.
7. Volz E, et al: Transmission of SARS-CoV-2 Lineage B.1.1.7 in England: Insights from linking epidemiological and genetic data. medRxiv 2021:2020.2012.2030.20249034.
8. Covid-19: New variant ‘raises R number by up to 0.7’ [https://www.bbc.co.uk/news/health-55507012]
9. Coronavirus: UK variant ‘may be more deadly’ [https://www.bbc.co.uk/news/health-55768627]
10. Tracking the international spread of SARS-CoV-2 lineages B.1.1.7 and B.1.351/501Y-V2 [https://virological.org/t/tracking-the-international-spread-of-sars-cov-2-lineages-b-1-1-7-and-b-1-351-501y-v2/592]
11. SARS-CoV-2 lineages: B.1.1.7 report [https://cov-lineages.org/global_report_B.1.1.7.html]
12. Tegally H, et al: Emergence and rapid spread of a new severe acute respiratory syndrome-related coronavirus 2 (SARS-CoV-2) lineage with multiple spike mutations in South Africa. medRxiv 2020:2020.2012.2021.20248640.
13. SARS-CoV-2 lineages: B.1.351 report [https://cov-lineages.org/global_report_B.1.351.html]
14. Genomic characterisation of an emergent SARS-CoV-2 lineage in Manaus: preliminary findings [https://virological.org/t/genomic-characterisation-of-an-emergent-sars-cov-2-lineage-in-manaus-preliminary-findings/586]
15. Phylogenetic relationship of SARS-CoV-2 sequences from Amazonas with emerging Brazilian variants harboring mutations E484K and N501Y in the Spike protein [https://virological.org/t/phylogenetic-relationship-of-sars-cov-2-sequences-from-amazonas-with-emerging-brazilian-variants-harboring-mutations-e484k-and-n501y-in-the-spike-protein/585]
16. SARS-CoV-2 lineages: P.1 report [https://cov-lineages.org/global_report_P.1.html]
17. Brief report: New Variant Strain of SARS-CoV-2 Identified in Travelers from Brazil [https://www.niid.go.jp/niid/en/2019-ncov-e/10108-covid19-33-en.html]
Appendix
Characteristics and potential biases of the Twitter-derived flows
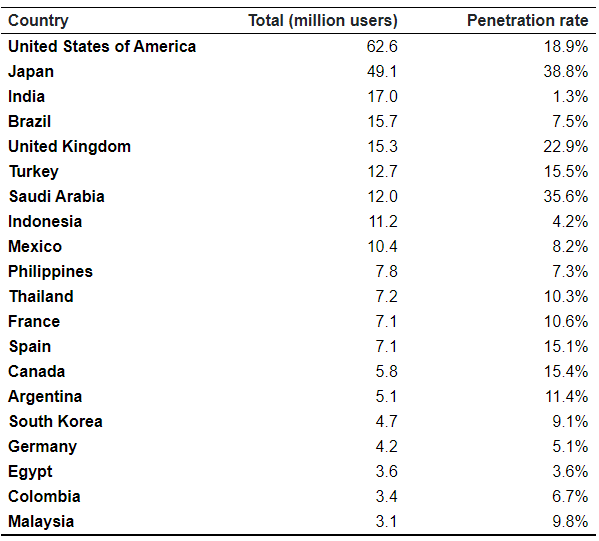
The data used in this report are daily Twitter-derived flows between countries and are subject to certain biases and limitations. Importantly, the data are not adjusted for origin population, and are therefore likely biased towards countries/regions with higher numbers of Twitter users, with better representation in these countries and poorer representation in others. The total number of Twitter users and the proportion of users as a percentage of the population of that country (the penetration rate) are given in Table A1.
Table A1. Countries with the most Twitter users in 2020 and penetration rates [1].
Moreover, the amount of data available on any given day is dependent on the activity of the Twitter users. Taking the USA as an example, Figure A1 shows how the total population in the Twitter-derived flows dataset changed over the year 2020. A clear peak is observed in early November, reflecting increased Twitter activity around the time of the USA 2020 presidential election.
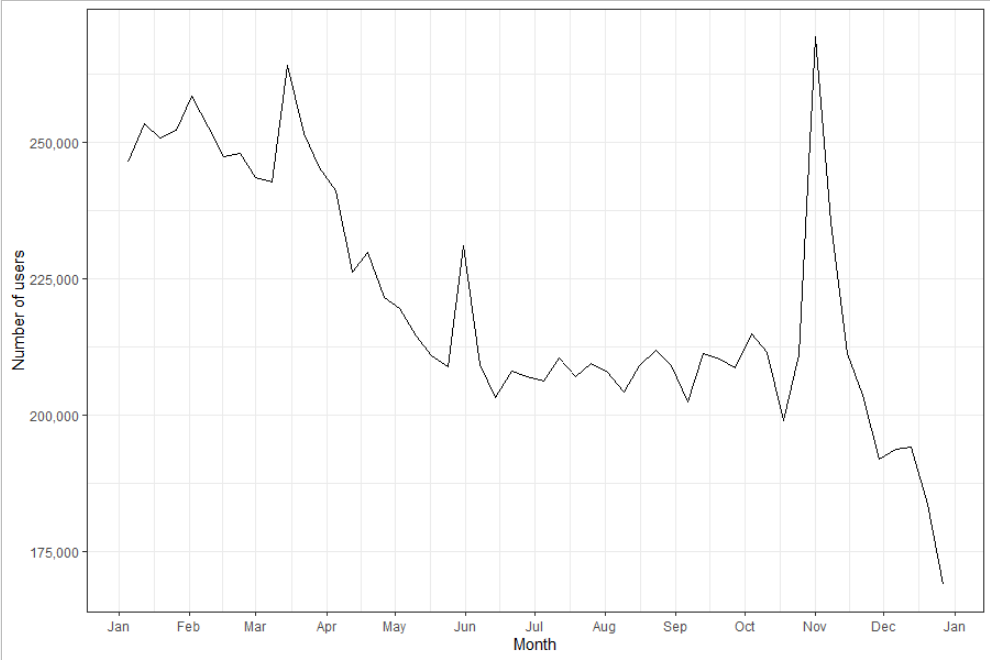
Figure A1. Weekly mean total population originating from the USA in the Twitter-derived flows over the year 2020.
Demographic biases in the Twitter-derived flows
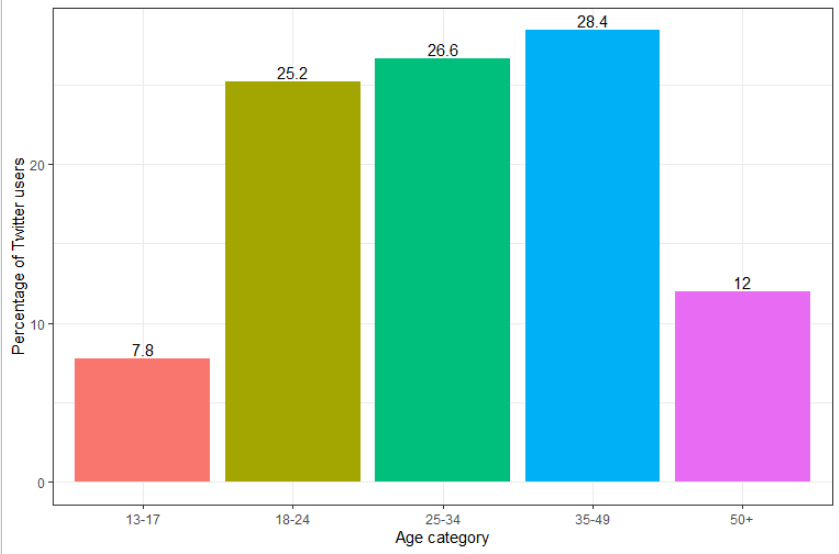
Moreover, because Twitter users do not represent the general population, data derived from this source have intrinsic biases due to the demographic difference between Twitter users and the general population. According to data provided by Statistica, Twitter users tend to be younger than the general population and more commonly male (68.5% male vs 31.5% female, [2]). Figure A2 shows the age distribution of Twitter users in 2020.
Closely collaborating with different data providers, ongoing work within WorldPop is focussed on comparisons of multiple datasets to better understand and quantify such biases.