
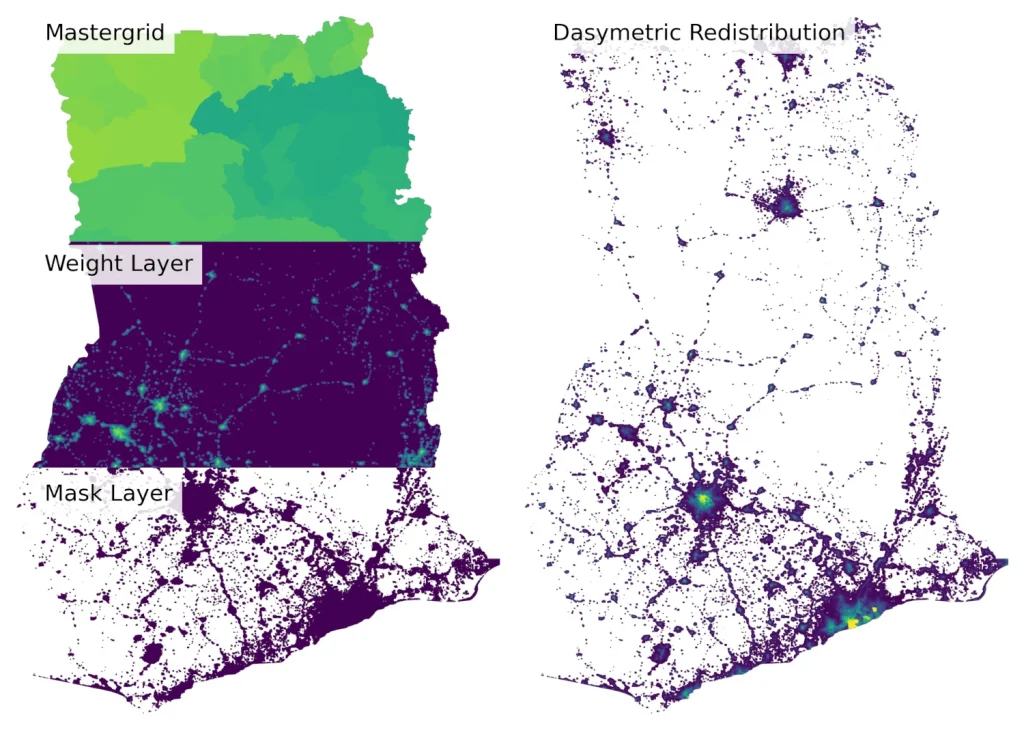
Creating accurate population maps often starts with a challenge: population data are typically reported for administrative areas, but decisions need to be made at a much finer scale.
To help bridge that gap, we have released pyDasymetric, a free, open-source Python package that makes it easier to redistribute population counts into high-resolution gridded population datasets using dasymetric mapping techniques.
Dasymetric mapping improves on simple area-based approaches by using spatial weighting information, such as settlement data, building density, land cover, or night-time lights, to estimate where people are most likely to live within an administrative unit. Instead of assuming populations are evenly distributed, pyDasymetric allocates people proportionally across grid cells while preserving official population totals.
Built for practical population mapping workflows, pyDasymetric can efficiently process large raster datasets using parallel processing and a memory-conscious architecture. This makes it suitable for applications ranging from demographic research and public health analysis to humanitarian response and development planning.
The package reflects our commitment to open, transparent, and reproducible geospatial methods. Researchers and practitioners can integrate pyDasymetric into existing workflows, adapt the code to their needs, and contribute improvements through GitHub.
Whether you’re producing national population grids or experimenting with new disaggregation approaches, pyDasymetric provides a straightforward and scalable way to turn population counts into actionable spatial intelligence.