
At WorldPop, we believe that everyone should count in data – especially the people who are most likely to be missed. That principle is at the heart of a new preprint and open data release we’re excited to share: the most detailed spatiotemporal analysis to date of childhood vaccination coverage in Nigeria, spanning 25 years from 2000 to 2024.
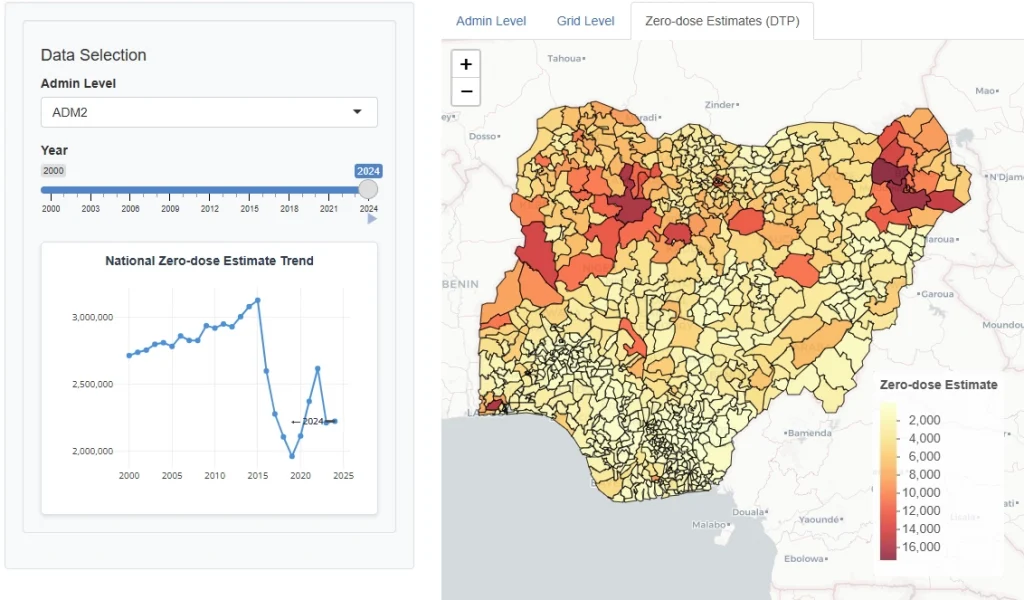
Using advanced geospatial methods, this work, led by Associate Professor Dr Edson Utazi, provides estimates of vaccination coverage at a 1×1 km resolution for key childhood vaccines. This level of detail allows health officials and partners to see, with clarity, where children are being missed by routine immunisation services and where “zero-dose” children (those who had not received the first dose of the diphtheria-tetanus-pertussis (DTP1) vaccine) are most likely to live.
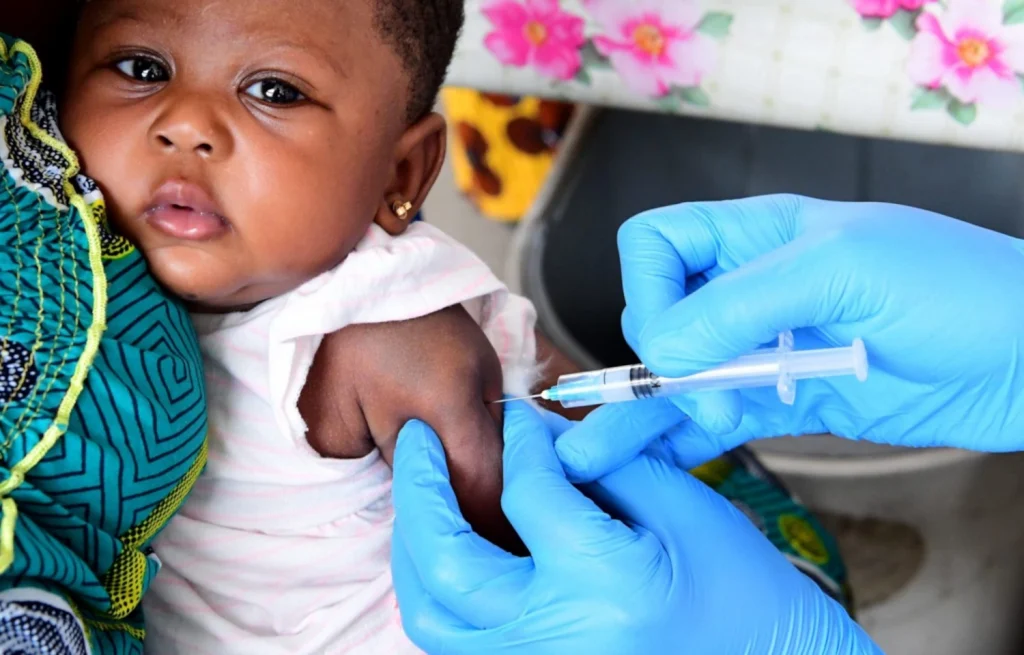
Nigeria remains one of the world’s highest-priority countries for immunisation efforts. Each year, millions of children do not receive life-saving vaccines. In 2024 alone, an estimated 2.1 million children did not receive any dose of the DTP vaccine, and around 3.1 million missed their measles-containing vaccine. National household surveys such as Demographic and Health Survey (DHS) and Multiple Indicator Cluster Survey (MICS) are essential for tracking progress, but they are often too coarse to guide local action. They can tell us how a country or state is performing, but not which communities, neighbourhoods, or settlements are being left behind.
To help close that gap, our team brought together data from five DHS surveys and two MICS surveys, alongside a wide range of geospatial information, including population distribution and accessibility. Using Bayesian geostatistical models, we created annual estimates of vaccination coverage for DTP1, DTP3, and the first dose of measles vaccine (MCV1), as well as the prevalence of zero-dose children. The result is a 25-year, high-resolution portrait of immunisation across Nigeria, from national trends down to individual grid cells.
What emerges is a story of both progress and persistent inequality. One of the clearest patterns is a long-standing north–south divide. Throughout the entire study period, northern regions have consistently had lower vaccination coverage than the south. While there were only modest improvements before 2015, coverage increased more rapidly in the years that followed, reaching a peak around 2019. Some northern states, including Jigawa and Yobe, saw particularly notable gains during this time. However, those improvements have since slowed, with coverage stagnating or even declining slightly in recent years.
Zero-dose children remain a major concern. Our estimates suggest that more than two million children in Nigeria fall into this category each year. The highest concentrations are found in the northeast and northwest, regions that already face multiple challenges related to access, insecurity, and health system capacity. At the same time, large southern cities such as Lagos also contain high absolute numbers of zero-dose children simply because of their population size, reminding us that urban settings are not immune to gaps in coverage.
The COVID-19 pandemic left a visible mark on immunisation services. While coverage declined across much of the country, the impact was particularly pronounced in northern states, pointing to differences in health system resilience and the need for targeted recovery efforts.
Crucially, these findings are not just intended for academic audiences. The purpose of producing data at this resolution is to support real-world decision-making. Programme managers can use the maps to identify local “cold spots” where the probability of low coverage is highest, assess whether vaccination campaigns are reaching the children they are meant to serve, and combine coverage estimates with travel-time data to understand how distance to health facilities contributes to children being missed.
In keeping with WorldPop’s commitment to open science, all of the data from this work are freely available. This includes gridded and population-weighted administrative level vaccination coverage estimates, measures of uncertainty, an interactive online explorer to visualise trends, and the full preprint describing the methods and results in detail. By making these resources accessible, we hope to support governments, NGOs, and researchers working to strengthen immunisation systems.
Ultimately, this work is about more than maps or models. By identifying, as precisely as possible, where children are being missed, we can help support Nigeria’s commitments under Immunization Agenda 2030 and contribute to a future in which every child – no matter where they are born – has a fair chance at a healthy start in life.
Explore the Data
The full suite of data, including gridded population-weighted estimates and uncertainty metrics, is available for download.
- Full Preprint: Read the complete analysis here (medRxiv)
- Open data: High-resolution, modelled DPT1,3 and MCV1 vaccination coverage and zero-dose estimates for Nigeria (2000-2024), version 1.0 (WorldPop)
- Interactive Explorer: View the trends yourself at the Nigeria Vaccination Explorer (ShinyApps)
- Movement for Immunization Agenda 2030 (IA2030) (Geneva Learning Foundation)
- Mapping the characteristics of under/un‐vaccinated children project (WorldPop)
We’re trialling the ‘Deep Dive’ audio summary feature of Google’s NotebookLM. This feature uses AI to create a podcast-like audio conversation between two AI-derived hosts that summarise key points of documents - in this case the full preprint article linked above.
As Google acknowledge that NotebookLM outputs may contain errors, we have been careful to check, edit and validate this audio.
Please contact us to let us know what you think.
Music: My Guitar, Lowtone Music, Free Music Archive (CC BY-NC-ND)