
What counts as a city? It sounds like a simple question, until you realise that countries define “urban” in exceptionally different ways. In Denmark, a settlement with 200 people qualifies as urban. In Japan, you need 50,000 residents plus certain economic activities. With standards this far apart, comparing cities across borders is challenging.
To smooth out these inconsistencies, the UN Statistical Commission endorsed the Degree of Urbanisation (DEGURBA), a harmonised framework proposed by a consortium of international organisations (EU, OECD, World Bank, FAO, UN-Habitat, ILO) led by the European Union, as a method for international comparison (not a replacement for national definitions). Instead of relying on national administrative definitions, it uses gridded population data to classify every place into one of three categories:
- Urban Centres (at least 1500 people per km2)
- Urban Clusters (at least 300 people per km2)
- Rural Areas (fewer than 300 people per km2)
By working on uniform grid cells and applying continuity rules, the approach avoids distortions caused by heterogeneous and time-varying administrative boundaries. It’s a simple, elegant idea. But there’s a catch: the framework is only as good as the population data that feeds it.
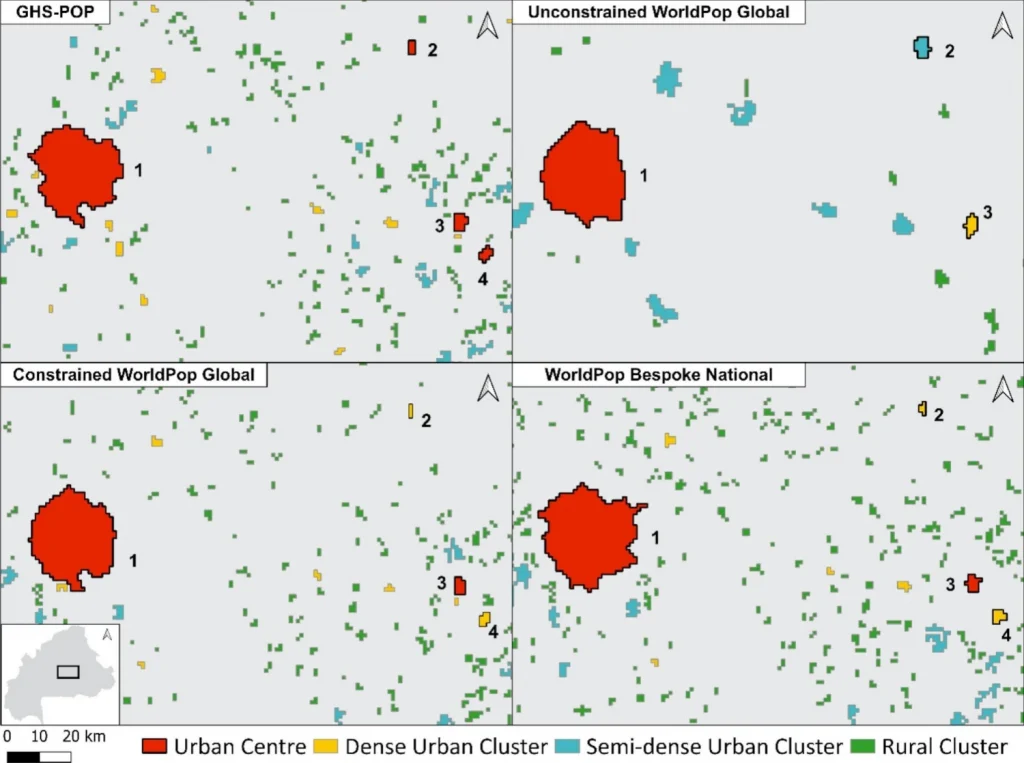
A recent study led by WorldPop Research Fellow Dr Wenbin Zhang tested this by applying the DEGURBA method in 16 countries across Africa and the Caribbean using four different population datasets. The goal was to see to what extent the choice of data actually changes the map.
The results were surprising. Different datasets often produced very different classifications, especially for those in-between “urban cluster” areas. On average, 27.5% of people ended up in what the study called “mixed classes,” where one dataset declared a place rural while another labelled it an urban cluster.
Why so much disagreement? It came down to how the datasets were built.
- Constrained Models
These models assign population only to places where buildings or settlements are detected. They lined up well with each other, and when researchers used only these, the confusing mixed classifications dropped by nearly 9 percentage points. - Unconstrained Models
One dataset spread population broadly, even into areas with no visible buildings. This “smoothing” made dense areas look less dense, wiping many cities off the map. Compared to the others, this model identified 42% fewer urban centres and 66% fewer dense clusters.
The study’s big takeaway is – DEGURBA works, if your data knows where people actually live. Constrained population grids, rooted in real settlement footprints, produce stable, reliable classifications. For governments, researchers, and development agencies using global urban maps, this means one thing: your definition of “urban” depends less on the method and more on the data underneath it.
If the population grid accurately reflects where buildings – and therefore people are – DEGURBA can be a powerful tool for comparing how communities grow, change, and thrive around the world.
We’re trialling the ‘Deep Dive’ audio summary feature of Google’s NotebookLM. This feature uses AI to create a podcast-like audio conversation between two AI-derived hosts that summarise key points of documents - in this case the “Assessing the impacts of gridded population model choice on degree of urbanisation metrics” paper linked below.
As Google acknowledge that NotebookLM outputs may contain errors, we have been careful to check, edit and validate this audio.
Please contact us to let us know what you think.
Music: My Guitar, Lowtone Music, Free Music Archive (CC BY-NC-ND)