
During today’s WorldPop Global 2 – Yearly High-Resolution Population Data in DHIS2 webinar, experts from DHIS2 and WorldPop unveiled how they are collaborating to assist researchers, NGOs and governments understand where people live and how to reach them with essential services. The incorporation of the new WorldPop Global 2 open dataset within the DHIS2 platform aims to aid the planning of education provision, vaccination programmes, disaster relief efforts, and other humanitarian and health services.
What’s New in Global 2?
Unlike WorldPop’s Global 1 data, Global 2 leverages both the 2010 and 2020 census rounds to create consistent projections from 2010 all the way to 2030. By combining satellite imagery with building footprint data, the models can now more accurately distinguish between residential neighbourhoods, commercial zones, and uninhabited parks. This means agencies can see not just how many people live in a district, but exactly where those people are clustered on the ground.
Bringing Data to Life in DHIS2
The integration of this data directly into DHIS2 allows health officials to move from spreadsheets to interactive maps. Key features include:
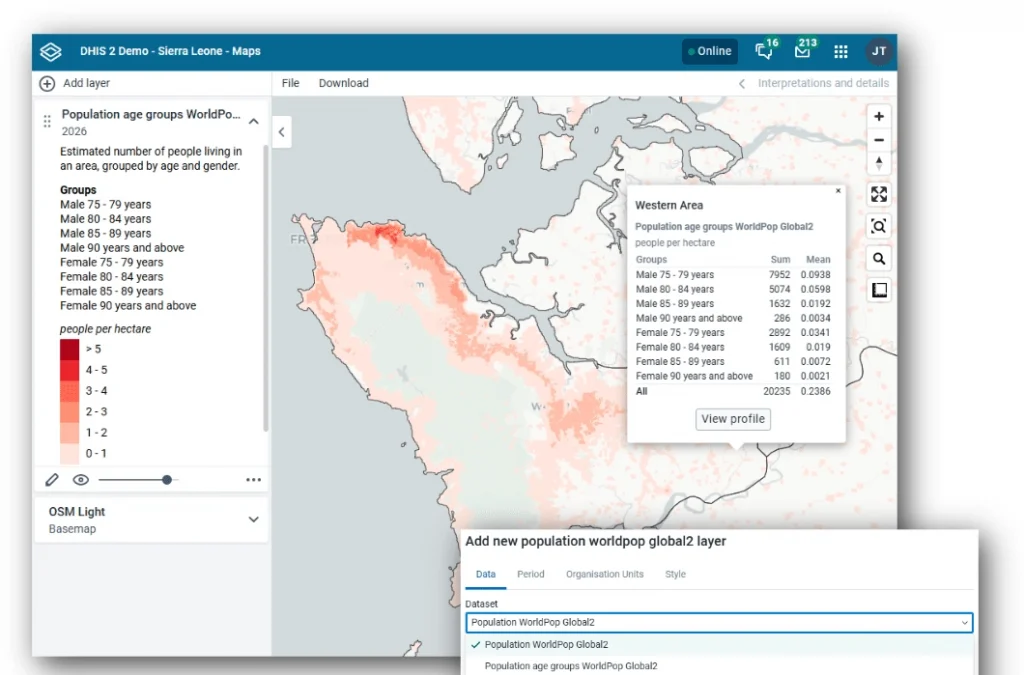
- The Maps App: Users can visualise total population or specific age and sex breakdowns right down to local administrative units.
- The Import/Export App: Health systems can now aggregate these high-resolution grids into their specific administrative districts. This allows for accurate coverage indicators, like dividing the number of vaccinations by the actual population of a specific village.
- Advanced Climate Tools: New Python-based toolkit allows developers to combine population data with environmental factors. For example, officials can now calculate population-weighted precipitation to identify exactly how many people are being impacted by extreme weather events.
A Growing Partnership
This advance marks a decade of collaboration between WorldPop at the University of Southampton and DHIS2 at the HISP Centre in the University of Oslo. Looking ahead, the teams are developing AI assistants and natural language processing tools to make querying this complex data as easy as asking a question in plain English, or multiple other languages.
For those looking to dive deeper, the DHIS2-WorldPop partnership will showcase practical use cases at the DHIS2 Annual Conference in June this year.
Questions answered
During the webinar, several questions were addressed regarding the technical requirements, data sources, and practical applications of the new WorldPop Global 2 dataset.
What versions of DHIS2 are required to access these new features?
- To use the Import/Export app with these features, you must be on DHIS2 version 2.41 or higher. For the Maps app, the features are available starting from version 2.40.
Is a new key required if I already use Google Earth Engine in DHIS2?
- No, there is no new key required. If you have already set up a Google Earth Engine key to access population or climate layers in the Maps app, you are ready to go.
Is the WorldPop model highly dependent on a country’s census data?
- The answer depends on the specific country. While the global data uses an assembly of census data from the 2010 and 2020 rounds where available, WorldPop also incorporates projections from the US Census Bureau and common operational data sets from UN agencies for countries that have not had a recent census. For countries with very unreliable census data, WorldPop co-develops bespoke estimates using alternative sources like health campaign data or household survey listings.
Does the climate data support weather prediction precision?
- The focus of the DHIS2 climate and health project is on making data available through “climate tools” to create better workflows. Specifically, they are using these datasets for prediction modelling to identify where future disease outbreaks might occur and how many people will likely be affected.
How can I calculate population estimates for specific health facility catchment areas?
- While the standard data is often aggregated at the administrative level, users can utilize the Microplanning app (by Crosscut) within DHIS2 to generate specific catchment area geometries for facilities. These custom boundaries can then be used to import and aggregate the gridded population data.