WorldPop Projects
Mapping the representativeness of health and demographic surveillance site networks
Project leads: Andy Tatem, Edson Utazi
Funding: Bill and Melinda Gates Foundation, INDEPTH network, CHAMPS network
A growing number of longitudinal data collection sites exist across the low and middle income regions of the world to circumvent unreliable national civil registration systems for estimates of mortality and their determinants. These sites are increasingly forming into collaborative networks, from which data are pooled to provide wide-area information. Morbidity and mortality generally correlate strongly with environmental and socioeconomic characteristics. Therefore to enable comparison between sites, understand which sites can be grouped and where additional sites would aid understanding of rates and determinants, determining the environmental and socioeconomic representativeness of networks becomes important.
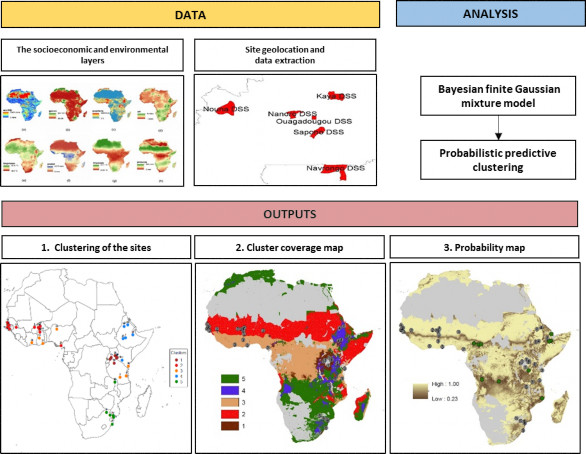
A full Bayesian methodology has been constructed for assessing the representativeness of surveillance networks, focusing on the INDEPTH network (www.indepth-network.org) in sub-Saharan Africa as an example. We develop a multi-dimensional finite Gaussian mixture model for clustering the existing sites. Using the fitted model we obtain the posterior predictive probability distribution of the cluster membership of each 1 × 1 km grid cell in Africa, the maximum of which is proposed as the criterion for the representativeness of the network for that particular grid cell. The analysis using the INDEPTH network is based on eight gridded socioeconomic and environmental variables/layers for Africa. From the analysis, five clusters of the sites were obtained as shown in Fig. 1. The areas represented by the clusters are displayed in the bottom-centre image, with the dark areas in the bottom right map highlighting low probability values that are poorly represented by the existing network and these constitute where additions to the network will help improve its coverage (see, e.g., the green circles).