
December 17th, 2021
Exploring international travel patterns and connected communities for understanding the spreading risk of VOC Omicron
Shengjie Lai1, Zhenlong Li2, Eimear Cleary1, Maksym Bondarenko1 and Andrew Tatem1
- 1WorldPop, School of Geography and Environmental Science, University of Southampton, UK
- 2Geoinformation and Big Data Research Laboratory, Department of Geography, University of South Carolina, USA
Email: Shengjie.Lai@soton.ac.uk
The novel SARS-CoV-2 variant of concern (VOC) Omicron (lineage B.1.1.529), together with four existing VOC variants, has raised serious concerns about the effectiveness of vaccines and the potential for a new wave of the pandemic (Figures 1 and 2) [1-3]. This new strain was first detected in in November 2021 in South Africa and among international cases with a travel history from southern African countries [1,3]. However, community transmission with associated clusters has now been reported in several countries. According to the COVID-19 Weekly Epidemiological Update published by the WHO, a total of 76 countries have reported confirmed cases of the Omicron variant, as of December 14, 2021 (Figure 3) [1].
Given limited capacities in diagnosis and healthcare in many countries, and the small fraction of infections that have been sequenced, the Omicron variant is likely to already be in many other countries without having been detected. Concerning the recent surge of cases across continents and the increasing reports of Omicron cases in December 2021 (Figure 1), gaining a better understanding of travel networks and connectivity will help to inform the potential range of Omicron transmission across regions. We therefore preliminarily explored the communities of population movements between at administrative level-1 units (e.g., provinces or states) across the globe for the October-November 2021 period. In this analysis, de-identified and aggregated international population movement data were derived from geotagged tweets during the period of October to November in 2021, by the ODT Flow Explorer [4]. In the context of travel networks, a community refers to a group of areas that are more closely connected internally than with other areas in the network [5,6]. The community structures detected by the Louvain algorithm are mapped out in Figure 4. The maps highlight distinct geographic groupings of regions during the Oct-Nov 2021 period that show strong internal connections in terms of movements. These emphasise geographic communities of regions whereby introductions of the Omicron VOC into any area within them have a higher risk of internal spread than to neighbouring communities. The outputs follow similar patterns to connectivity mapping undertaken elsewhere using alternative mobility and infrastructure data (e.g. [7-10]).
It is important to note that the biases within these geolocation data obtained from smartphone/Apps/social media are not well characterised and that they likely skew towards different geographies, user groups, income groups, and younger populations. Children, the elderly and the poorest are likely to be not as well represented. The characteristics and potential biases of Twitter-derived travel flows can be found in our previous report (www.worldpop.org/events/covid_variants)). Ongoing work within WorldPop is focussed on comparisons of multiple datasets in order to better understand and quantify such biases.
We are closely monitoring the rapidly changing situation, and further analyses will be conducted to update analyses on the risk of international spread and onward transmission of new SARS-CoV-2 variants via population movement. More details about WorldPop’s COVID-19 studies and datasets for supporting the global response to the ongoing pandemic can be found at www.worldpop.org/covid19. The COVID-19 studies conducted by the Geoinformation and Big Data Research Laboratory at the University of South Carolina can be also found at http://gis.cas.sc.edu/gibd/covid-19/.
Acknowledgements
We acknowledge the efforts of the World Health Organization in sharing the COVID-19 Weekly Epidemiological Update, the Johns Hopkins University Center for Systems Science and Engineering (JHU CSSE) for collating the COVID-19 case data (github.com/CSSEGISandData/COVID-19), and the researchers that are part of the cov-lineages.org team in assembling the records for new strains.
Reference
- World Health Organization. Weekly epidemiological update on COVID-19 – 14 December 2021. https://www.who.int/publications/m/item/weekly-epidemiological-update-on-covid-19—14-december-2021
- Li J., Lai S., Gao G.F. et al. The emergence, genomic diversity and global spread of SARS-CoV-2. Nature 2021,600,408–418. DOI:10.1038/s41586-021-04188-6
- Global Lineage Reports. https://cov-lineages.org/index.html#global_reports
- Li Z., Huang X., Hu T., Ning H., Ye X., Huang B., Li X., (2021), ODT FLOW: A Scalable Platform for Extracting, Analyzing, and Sharing Multi-source Multi-scale Human Mobility, Plos One, 16(8): e0255259. https://doi.org/10.1371/journal.pone.0255259
- Blondel VD, Guillaume J-L and Lambiotte R et al. Fast unfolding of communities in large networks. J Stat Mech Theory Exp 2008; 10: P10008.
- Li Z., Huang X., Ye X. et al. Measuring global multi-scale place connectivity using geotagged social media data. Sci Rep 11, 14694 (2021). DOI:10.1038/s41598-021-94300-7
- Strano, E., Viana, M.P., Sorichetta, A. et al. Mapping road network communities for guiding disease surveillance and control strategies. Sci Rep 2018,8,4744. DOI:110.1038/s41598-018-22969-4
- Tatem A., David L. Smith. International population movements and regional Plasmodium falciparum malaria elimination strategies. PNAS 2010,107(27):12222-7. DOI:10.1073/pnas.1002971107
- Ruktanonchai, N.W., Bhavnani, D., Sorichetta, A. et al. Census-derived migration data as a tool for informing malaria elimination policy. Malar J 2016,15,273. DOI:10.1186/s12936-016-1315-5
- Ruktanonchai NW, Floyd JR, Lai S, et al. Assessing the impact of coordinated COVID-19 exit strategies across Europe. Science 2020,369(6510):1465-70. DOI:10.1126/science.abc5096
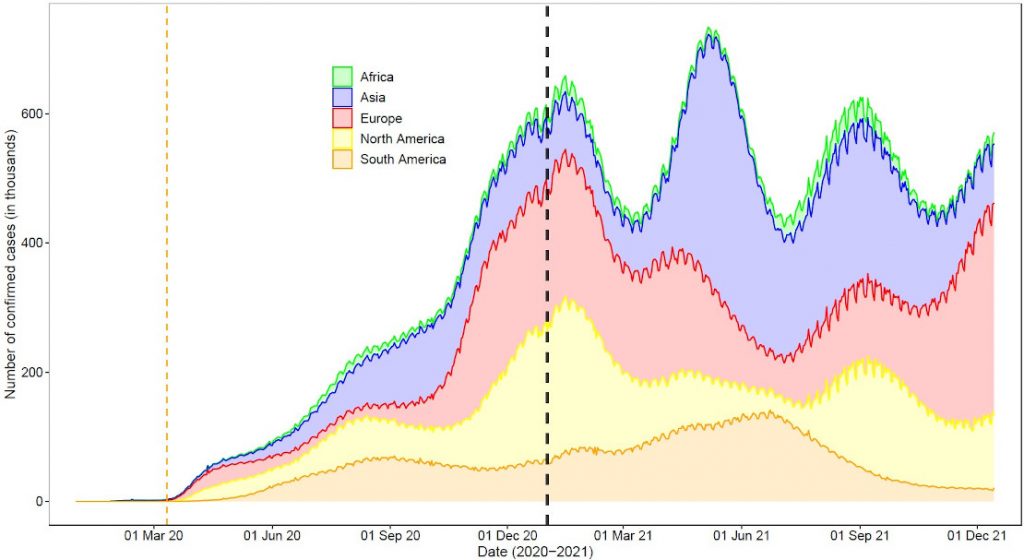
Figure 1. The seven-day rolling average of the number of confirmed cases of COVID-19 reported by continent. The orange vertical dashed line indicates the date of COVID-19 declared as a pandemic by the WHO. The black vertical dashed line represents January 1, 2021. The dataset of case numbers was obtained from the data repository collated by the Johns Hopkins University, as of December 14, 2021.
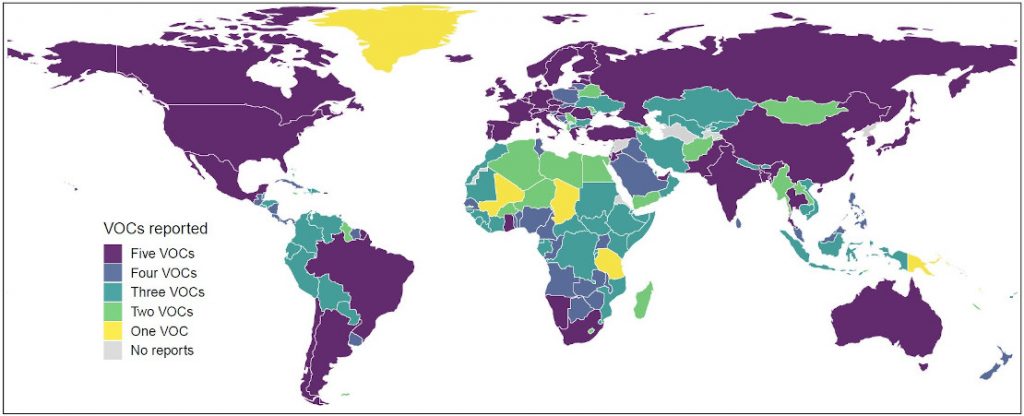
Figure 2. Reports of five VOCs (denoted VOC Alpha, Beta, Gamma, Delta, and Omicron) based on records published at the COVID-19 Weekly Epidemiological Update by the World Health Organization, as of December 14, 2021 (https://covid19.who.int/). The administrative boundary maps were obtained from Natural Earth (www.naturalearthdata.com).
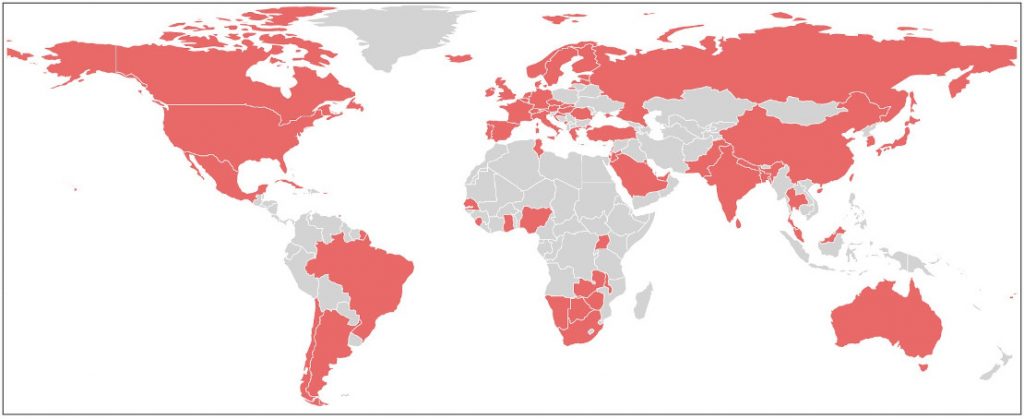
Figure 3. Reports of VOC Omicron, based on records published at the COVID-19 Weekly Epidemiological Update by the World Health Organization, as of December 14, 2021 (https://covid19.who.int/). The areas with confirmed Omicron cases are coloured in red. The administrative boundary maps were obtained from Natural Earth (www.naturalearthdata.com)
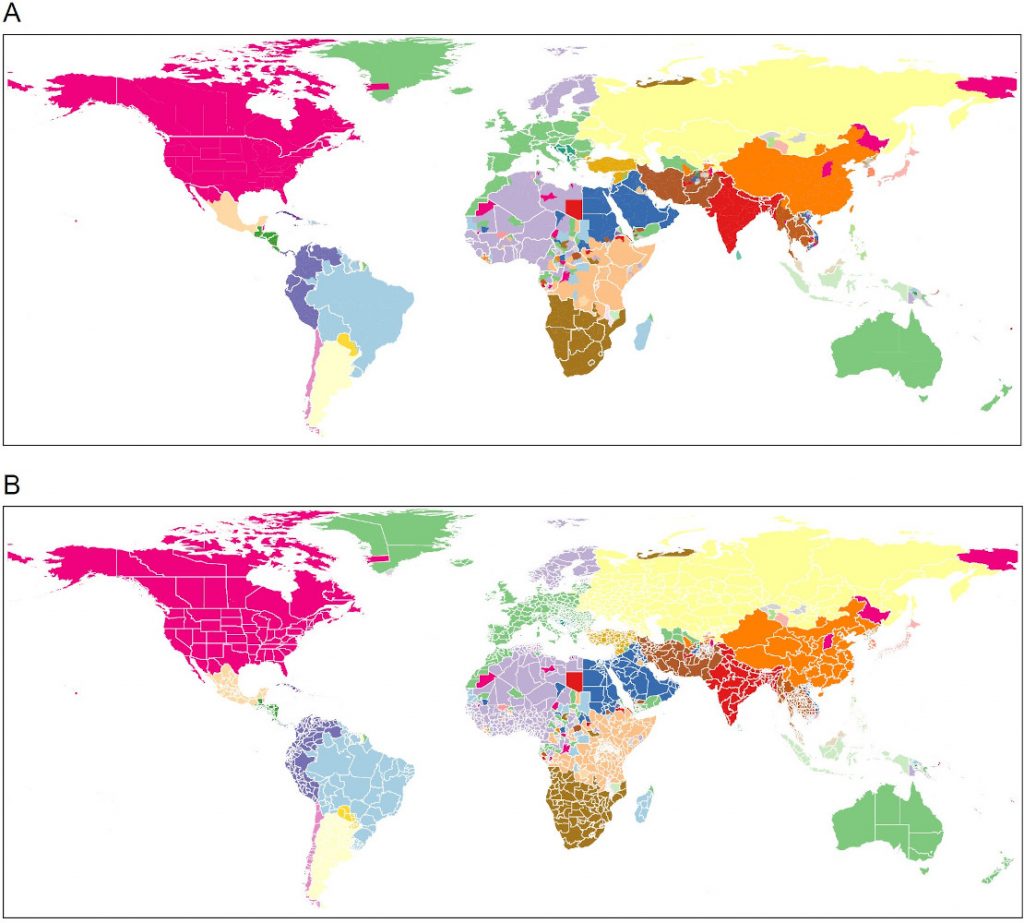
Figure 4. Main communities of international travel at administrative level 1 in October – November 2021. (A) Communities mapped with boundary at admin level 0. (B) Communities mapped with boundary at admin level 1. Geographically adjacent areas of the same colour represent a community that is internally and closely connected in terms of human movement. The community structure was detected by the Louvain algorithm. The mobility data are aggregated by the ODT Flow Explorer (http://gis.cas.sc.edu/GeoAnalytics/od.html), using human mobility metrics derived from geotagged Twitter data. The sub-division maps at administrative level 1 were obtained from GADM (https://gadm.org/).