
Effect of non-pharmaceutical interventions for containing the COVID-19 outbreak
Shengjie Lai1*, Nick W Ruktanonchai1*, Liangcai Zhou2, Olivia Prosper3, Wei Luo4,5 Amy Wesolowski6, Chi Zhang7, Xiangjun Du7, Hongjie Yu8, and Andrew J Tatem1
1WorldPop, School of Geography and Environmental Science, University of Southampton, UK
2Wuhan Center for Disease Control and Prevention, Wuhan, Hubei Province, China
3Department of Mathematics, University of Tennessee, Knoxville, TN, USA
4Computational Health Informatics Program, Boston Children’s Hospital, Boston, MA, USA
5Department of Pediatrics, Harvard Medical School, Boston, MA, USA
6Department of Epidemiology, Johns Hopkins Bloomberg School of Public Health, Baltimore, MD, USA
7School of Public Health (Shenzhen), Sun Yat-sen University, Shenzhen, China
8School of Public Health, Fudan University & Key Laboratory of Public Health Safety, Ministry of Education, Shanghai, China
*These authors contributed equally to this report.
Correspondence: Shengjie Lai (Shengjie.Lai@soton.ac.uk) and Andrew J Tatem (A.J.Tatem@soton.ac.uk)
Summary
The COVID-19 outbreak containment strategies in China based on non-pharmaceutical interventions (NPIs) appear to be effective1-4. Quantitative research is still needed however to assess the efficacy of different candidate NPIs and their timings to guide ongoing and future responses to epidemics of this emerging disease across the World1.
We built a travel network-based susceptible-exposed-infectious-removed (SEIR) model to simulate the outbreak across cities in mainland China. The code of the model is available online at Github. We used epidemiological parameters estimated for the early stage of outbreak in Wuhan to parameterise the transmission before NPIs were implemented5. To quantify the relative effect of various NPIs, daily changes of delay from illness onset to the first reported case in each county were used as a proxy for the improvement of case identification and isolation across the outbreak. Historical and near-real time human movement data, obtained from Baidu location-based service6, were used to derive the intensity of travel restrictions and contact reductions across China (Figure 1). The model and outputs were validated using daily reported case numbers, with a series of sensitivity analyses conducted.
We estimated that there were a total of 114,325 COVID-19 cases (interquartile range [IQR] 76,776 – 164,576) in mainland China as of February 29, 2020, and these were highly correlated (p<0.001, R2=0.86) with reported incidence (Figure 2). Without NPIs, the number of COVID-19 cases would likely have shown a 67-fold increase (IQR: 44 – 94), with the effectiveness of different interventions varying (Table 1 and Figure 3). The early detection and isolation of cases was estimated to prevent more infections than travel restrictions and contact reductions, but integrated NPIs would achieve the strongest and most rapid effect. If NPIs could have been conducted one week, two weeks, or three weeks earlier in China, cases could have been reduced by 66%, 86%, and 95%, respectively, together with significantly reducing the number of affected areas (Table 1 , Figure 4 and Figure 5). However, if NPIs were conducted one week, two weeks, or three weeks later, the number of cases could have shown a 3-fold, 7-fold, and 18-fold increase across China, respectively (Table 1 and Figure 5). Results also suggest that the social distancing intervention should be continued for the next few months in China to prevent case numbers increasing again after travel restrictions were lifted on February 17, 2020 (Figure 5).
The NPIs deployed in China appear to be effectively containing the COVID-19 outbreak, but the efficacy of the different interventions varied, with the early case detection and contact reduction being the most effective. Moreover, deploying the NPIs early is also important to prevent further spread. Early and integrated NPI strategies should be prepared, adopted and adjusted to minimize health, social and economic impacts in affected regions, considering the narrowing window of opportunity around the World7,8
Reference
- World Health Organization. Report of the WHO-China Joint Mission on Coronavirus Disease 2019 (COVID-19). 2020. (accessed 1 March 2020).
- World Health Organization. Press Conference of WHO-China Joint Mission on COVID-19. 2020. (accessed 26 February 2020)
- Novel Coronavirus Pneumonia Emergency Response Epidemiology Team. The epidemiological characteristics of an outbreak of 2019 novel coronavirus diseases (COVID-19) in China. Chinese Journal of Epidemiology 2020; 41(2): 145-51.
- Chen W, Wang Q, Li YQ, et al. Early containment strategies and core measures for prevention and control of novel coronavirus pneumonia in China. Chinese Journal of Preventive Medicine 2020; 54(3): 1-6.
- Li Q, Guan X, Wu P, et al. Early Transmission Dynamics in Wuhan, China, of Novel Coronavirus-Infected Pneumonia. N Engl J Med 2020
- Baidu Migration. (accessed 8 February 2020).
- World Health Organization. Novel coronavirus (2019-nCoV). 2020. (accessed 29 February 2020).
- World Health Organization. Coronavirus Disease (COVID-19) Press Conference, 21 February 2020. 2020. (accessed 23 February 2020).
Table 1. Reports and estimates of the COVID-19 cases in mainland China, as of February 29, 2020.
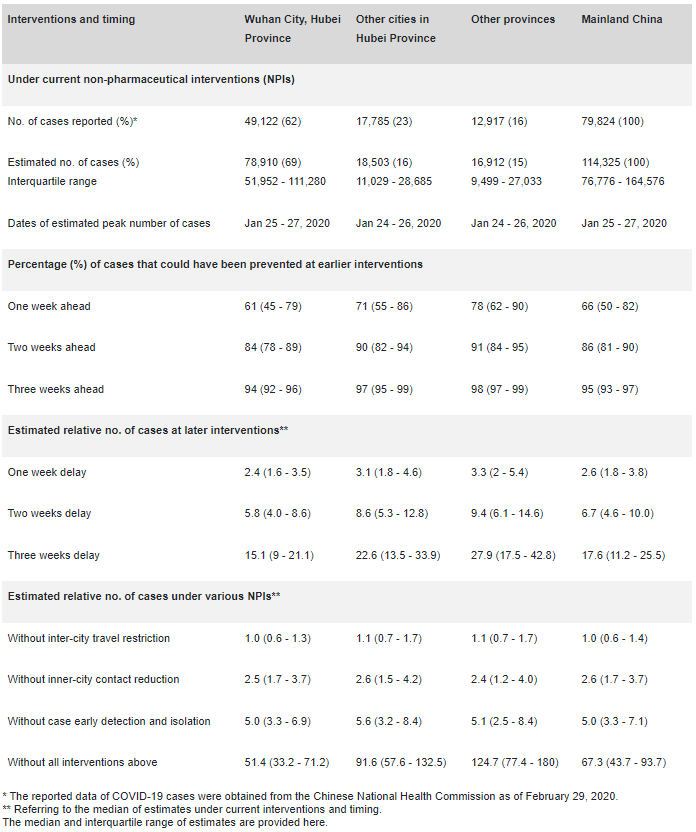
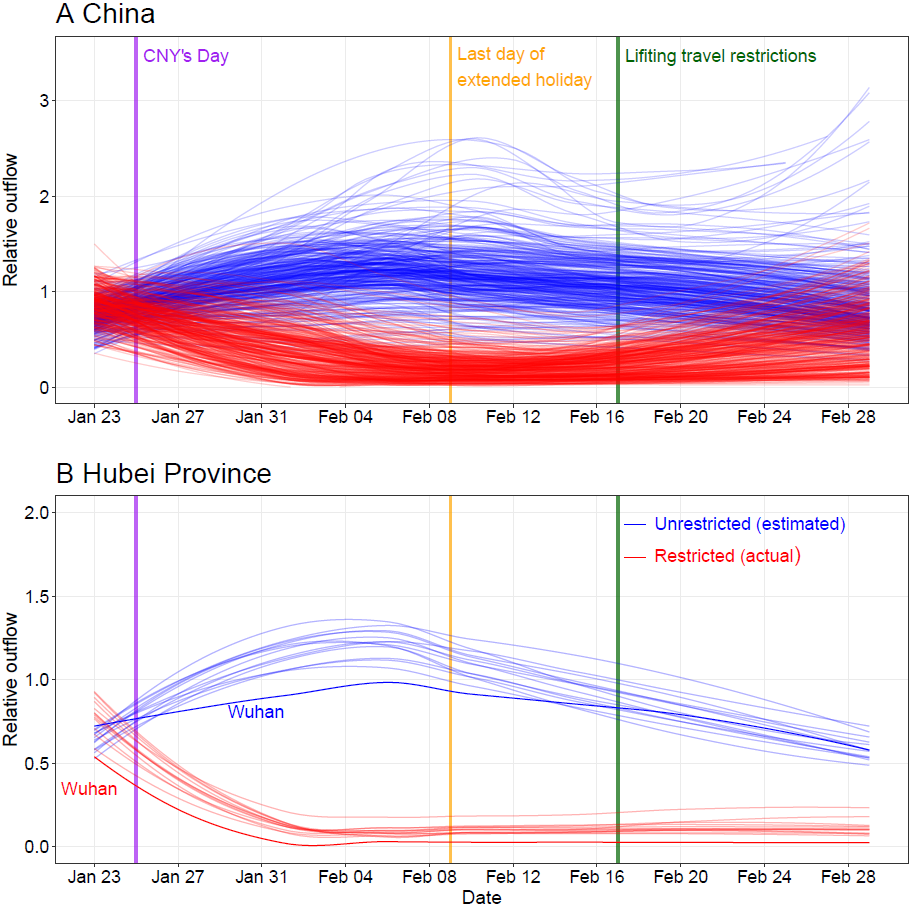
Figure 1: Relative daily volume of outbound travellers from cities (prefectural level) across mainland China during Chinese New Year (CNY) holiday, January 23rd – February 29th, 2020.
(A) All cities in mainland China. (B) Cities in Hubei province with Wuhan highlighted by using dark colours. Each blue line represents estimates of normal outflow by city under the scenario without travel restriction, following travel in previous years. The lines of relative volume were smoothed by using locally estimated scatterplot smoothing (LOESS) regression.
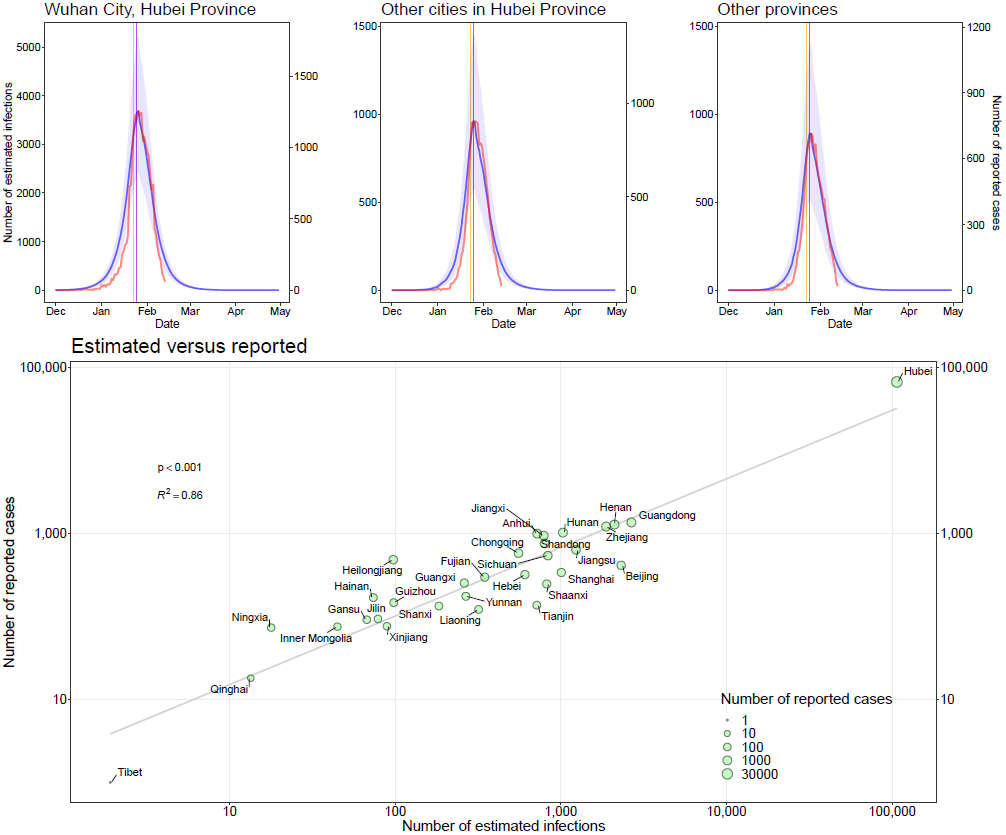
Figure 2: Estimated and reported epicurves of COVID-19 outbreak in China
Vertical lines: orange – date of Wuhan’s lockdown; purple – Chinese New Year’s day. The median and interquatile range (blue) of estimates of COVID-19 cases are presented with reported cases (red) by date of illness onset as of February 13, 2020. The reported data of COVID-19 cases in the scatterplot were obtained from the Chinese National Health Commission, as of February 29, 2020.
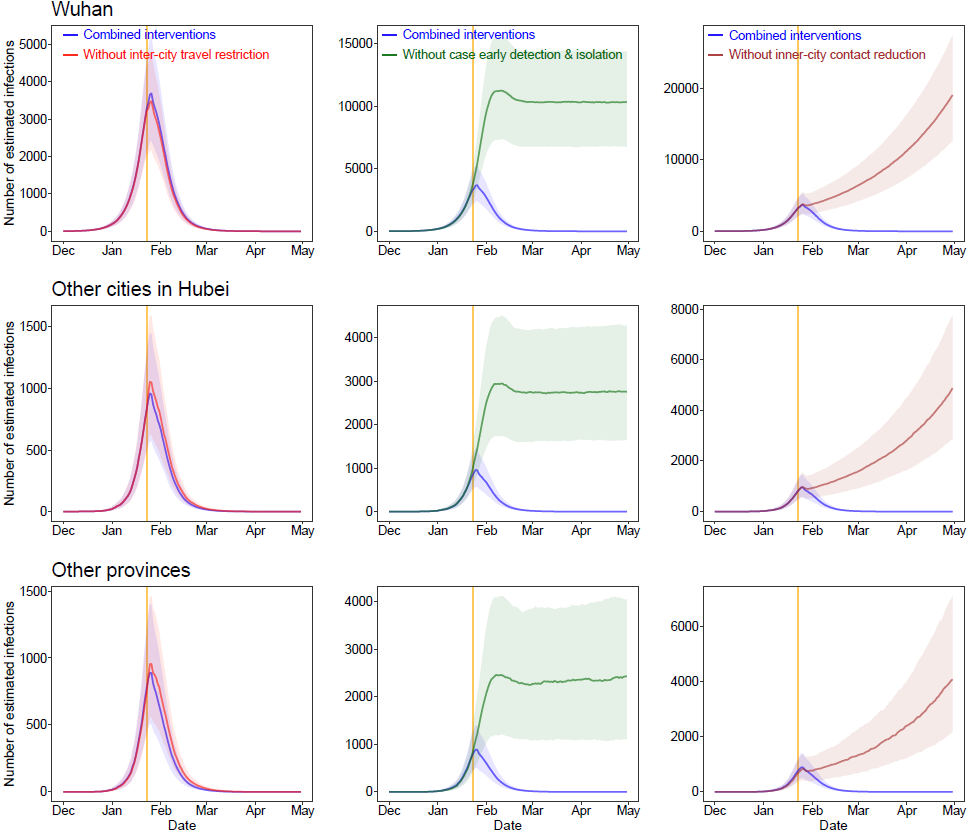
Figure 3: Estimated epicurves of COVID-19 outbreak under various scenarios with or without non-pharmaceutical interventions (NPIs) by region.
The blue lines present estimated transmission under current NPIs, and each other line represents the scenario without one type of intervention. The median and interquartile range of estimates are provided here. The orange vertical line indicates the date of Wuhan’s lockdown on January 23, 2020.
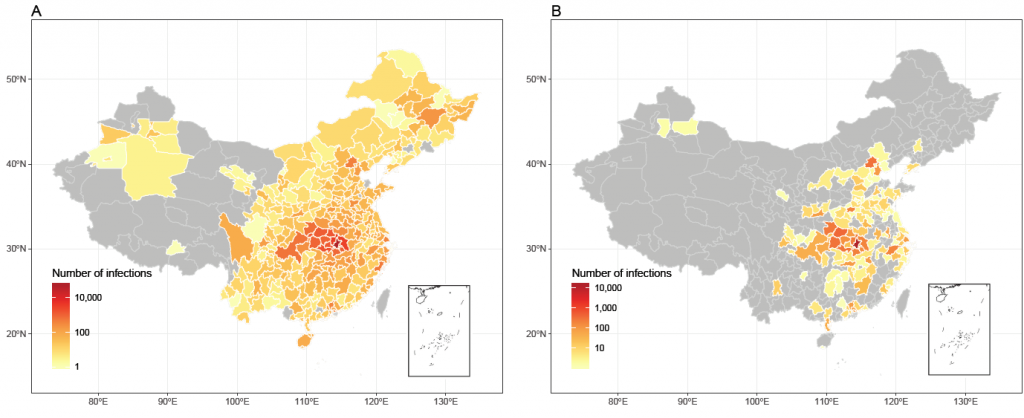
Figure 4: Affected areas of COVID-19 in mainland China as of February 29, 2020, under current interventions but with different timings.
(A) Affected areas under interventions implemented at actual timing. A total of 308 cities reported cases, based on the data obtained from national and local health authorities, as of February 29, 2020. (B) Affected areas under interventions implemented at two weeks earlier than actual timing, with an estimate of 130 cities affected.
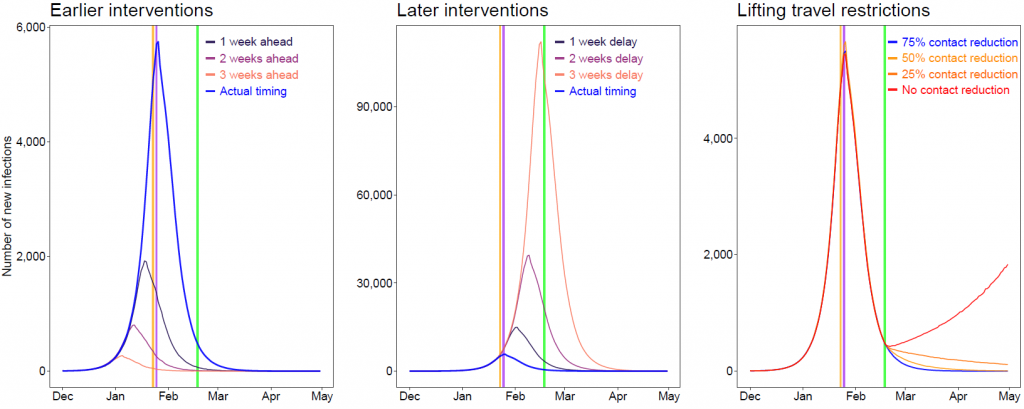
Figure 5: Estimates of the COVID-19 epidemic under various scenarios of intervention timing, travel restriction and contact reduction.
Vertical lines: orange – date of Wuhan’s lockdown; purple – CNY’s Day; green – date of lifting of travel restrictions. The epidemics under various intervention timings were estimated under current non-pharmaceutical interventions. We estimated the COVID-19 spread under different population contact rates after lifting inter-city travel restrictions across the country on Feburary 17, 2020.