

Population Weighted Density
* GIS consultant, MRes from UCL Centre for Advanced Spatial Analysis
** WorldPop
The traditional and most widely understood method for calculating an aggregate measure of human population density within any geographical region is simply to divide its total population by the total area (i.e. d = ΣP/ΣA). It has long been recognised in the field of geography and by many other scholars that this method has significant shortcomings for certain types of research, particularly in the human sciences and where the subject matter of interest may be related to the typical density levels experienced by the population, such as in epidemiology.
Population Weighted Density (PWD) – proposed by John Craig in 1984 is a family of methods that – as the name suggests – weight the density values by their corresponding population sizes in the aggregation process. We have utilised three distinct methods to generate PWD estimates:
PWD-G (Geometric Mean)
PWD-G denotes population weighted geometric mean density – based on the weighted geometric mean , for which the most practical calculation relies on log arithmetic, and hence requires all values to be non-zero.
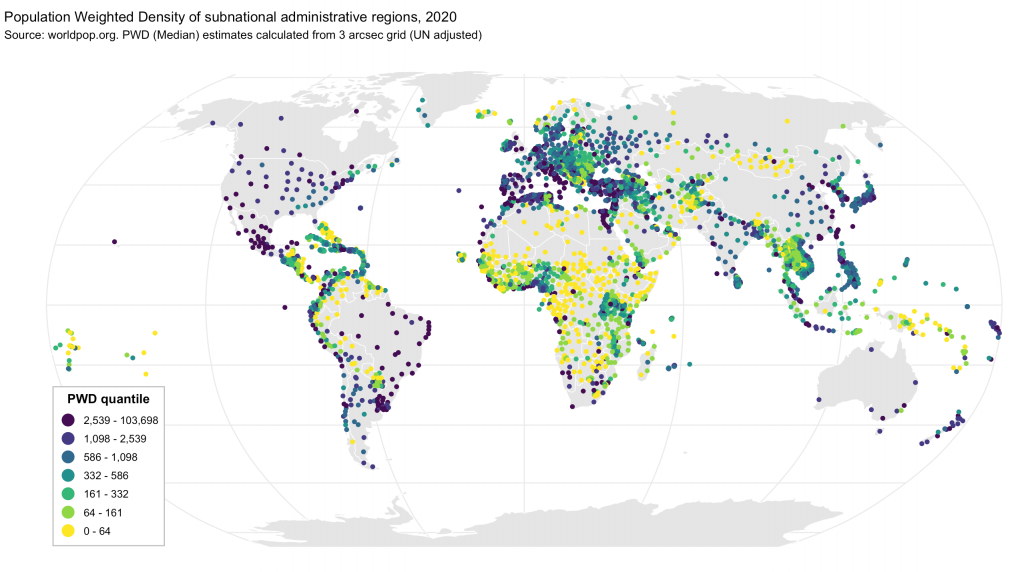
PWD-M (Median)
To the above established methods we add a third population weighted median density based on weighted median , as suggested by Ottensmann (2018). The map above gives our subnational PWD-M estimates for 2020.
Comparison
PWD-A seems the most commonly used method for PWD estimation – this is the method adopted by the US Census – probably due to it being the most intuitive to understand. However it shares the arithmetic mean’s inherent vulnerability of being highly sensitive to outliers, which are common in population density data. Hence any statistical error in the top-end of density values also has a disproportionate effect on the PWD-A estimate. PWD-G is a more robust metric that for lognormal data distributions will tend towards the median value, and is therefore less vulnerable (though not immune) to outliers. PWD-M by contrast is largely immune to outliers, though this does comes at the cost of being largely insensitive to the region’s top-end densities.
What’s in the release?
In this release we publish four sets of PWD estimates – two based on the WorldPop’s 3 arc-second grid (approximately 100m cell size at the equator) and two on its 30 arc-second grid (approximately 1km at the equator). Estimates are provided for top-level subnational regions as well as at national level. For each set we offer these estimates for each 5 year snapshot since 2000.
In addition to PWD estimates we are offering quantile breakdowns of the PWD distributions – percentiles for national level and deciles for subnational regions. This we hope will be a rich resource for any research that might benefit from more granular perspective on population density.
| Source data resolution | National level | Subnational regions (ADM1) |
|---|---|---|
| 3 arcsecond (“100m”) | PWD-A PWD-G PWD-M PWD percentiles |
PWD-A PWD-G PWD-M PWD deciles |
| 30 arcsecond (“1km”) | PWD-A PWD-G PWD-M PWD percentiles |
PWD-A PWD-G PWD-M PWD deciles |
We also include the population weighted centroids (longitude, latitude) for national and subnational levels based on arithmetic mean.
Usage
We encourage users to explore the data as well as the theory to come to a view on which PWD method and which source resolution are most suited to their research, though for general usage we would advise using PWD-G or PWD-M. For any queries or even just to let us know how the data is used please email us.