
Mapping populations
A primary focus of WorldPop is ensuring that the methods developed and resulting output datasets undergo academic peer review. Therefore, to keep up with the latest methods, we recommend visiting our publications page. The methods outlined below are becoming outdated and have been superseded in some places – we are working to update these based on newly published papers.
Maps of human population distributions have found use in disease burden estimation, epidemic modelling, resource allocation, disaster management, accessibility modelling, transport and city planning, poverty mapping and environmental impact assessment amongst other applications. High-income countries often have extensive mapping resources and expertise at their disposal to create such databases, but across the low income regions of the world, relevant data are either lacking or are of poor quality. The scarcity of mapping resources, lack of reliable validation data and difficulty in obtaining high resolution contemporary census statistics remain major obstacles to settlement and population mapping across the low income regions of the World. WorldPop develops methods to exploit and integrate the growing range of geospatial data on human populations, their demographics and factors relating to population distributions. Census, survey, satellite, social media, cellphone and other spatial datasets are all integrated in flexible and peer-reviewed statistical methods to produce open, fully-documented and consistent gridded maps of population distributions. Gridded population maps, whereby population numbers per 100x100m grid square are estimated, represent a more consistent representation of population distributions across a landscape than administrative unit counts, as well as enabling smooth integration with multiple other gridded datasets.
Population distributions
The accuracy of gridded population mapping is strongly related to the availability of contemporary and spatially detailed population census data. WorldPop works with statistics agencies, ministries of health and other organizations to construct databases of the most spatially detailed and recent population census data available, and match these to corresponding administrative boundaries. The figure below shows examples of such datasets for three countries.
Administrative units within a country typically vary substantially in their shapes and sizes, making the consistent mapping of population distributions and densities across a country, and their integration with other datasets produced on differing spatial frameworks challenging. WorldPop have developed peer-reviewed spatial statistical methods, exploiting the power of machine learning, to transform and disaggregate population counts at administrative unit levels to 100x100m grid square level, exploiting relationships with spatial covariate layers from satellites and other sources. The figure below shows an example for northern Vietnam.
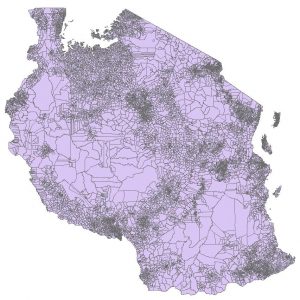
Example WorldPop input census datasets, showing the level of spatial detail of population count data used for Tanzania 2012, administrative level 4 .
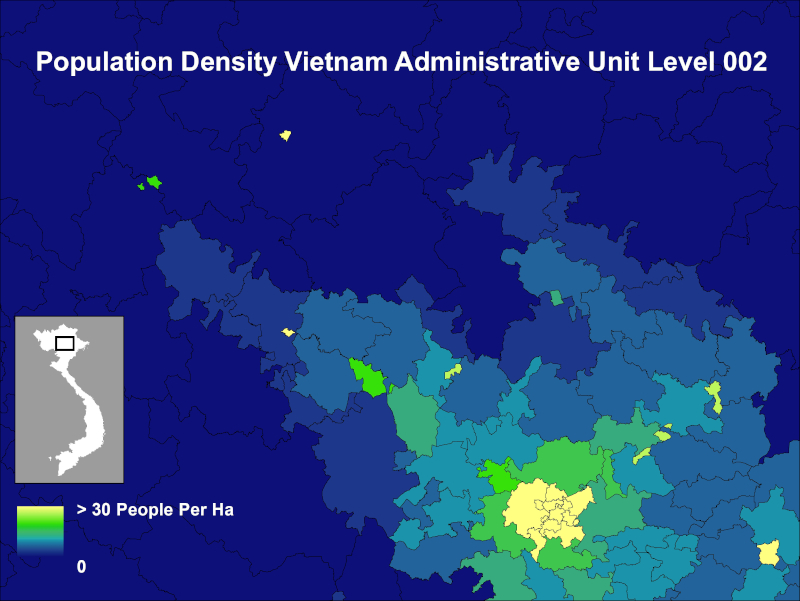
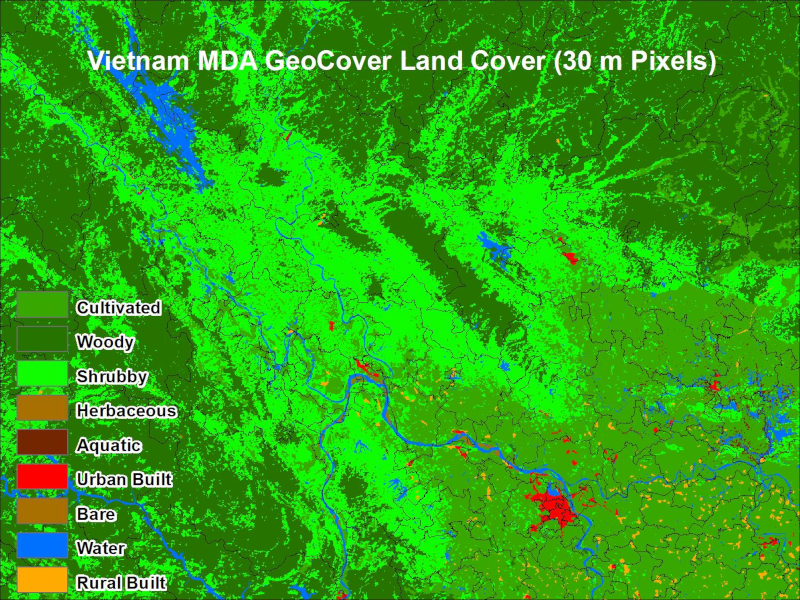
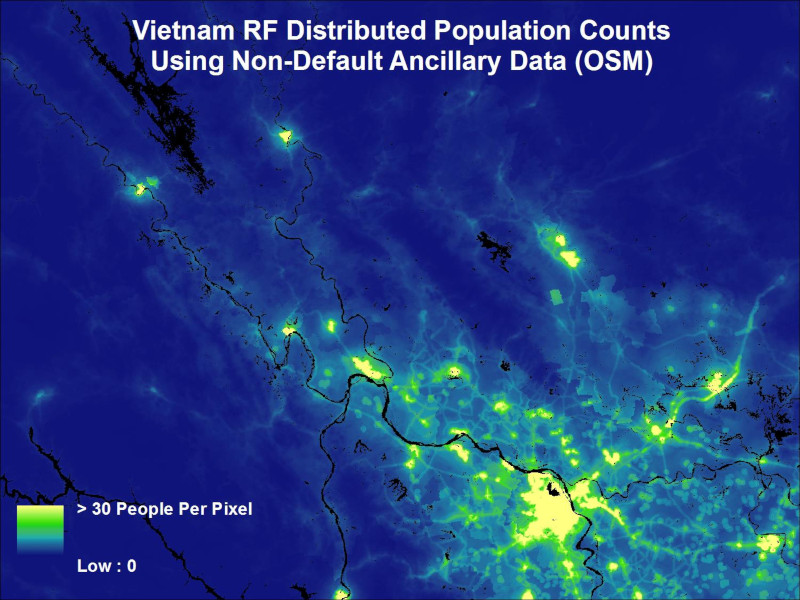
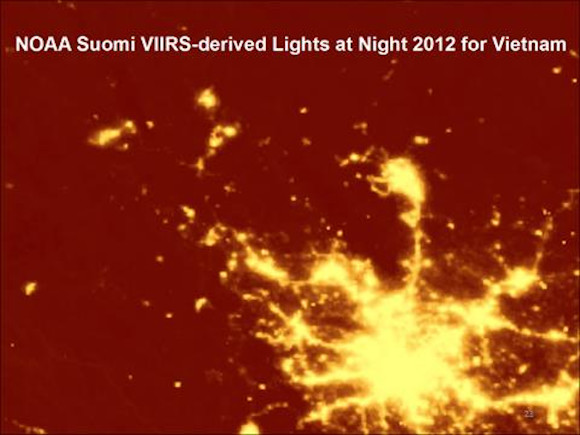
WorldPop population mapping example: (Top-left) Population density from census data for each administrative level 2 unit in an area of northern Vietnam, (Top-right) Land cover dataset for the same area, (Bottom-left) Satellite image of the area at night, (Bottom-right) WorldPop population modelling methods take the census data as input, then use machine learning methods to exploit the relationship between population density and high resolution landscape features, such as those from land cover and satellite data, to predict population densities for each 100x100m grid cell on the landscape.
No population mapping method is perfect, and therefore it is important to communicate the input datasets, methods and accuracies of the output maps. WorldPop undertake this through providing comprehensive metadata with each country population distribution map, which documents which datasets were used in its production, the approaches taken, as well as measures of accuracy. The figure below shows examples of these, and metadata are available with the datasets that can be freely downloaded here.
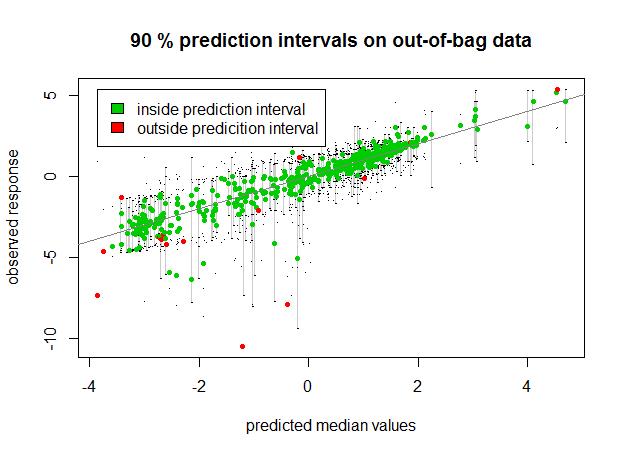
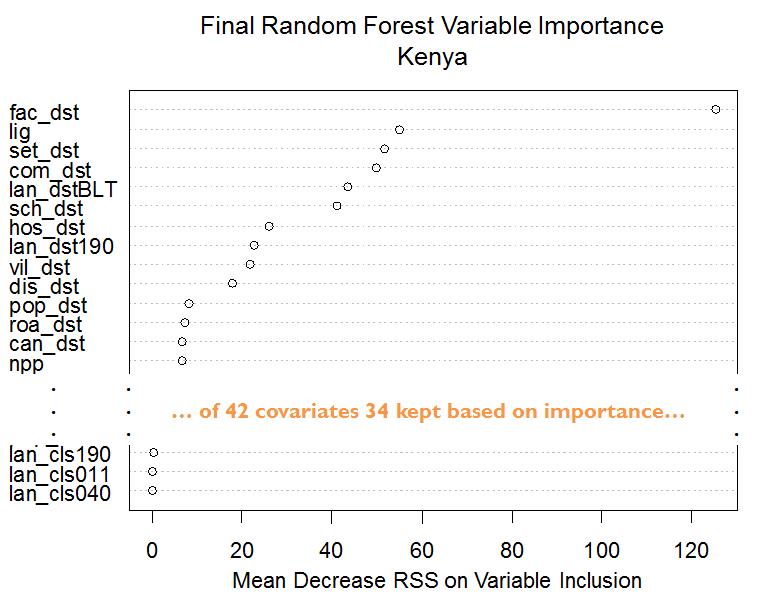
Example WorldPop mapping statistical analytics available in the metadata for country population maps: (Left) Internal accuracy assessment showing prediction errors for each administrative unit in a country; (Right) Assessment of the importance of difference input spatial data layers in improving the accuracy of population mapping. Further info available here.
WorldPop population distribution datasets have been used in applications around the World, covering the fields of urban planning, epidemiology, humanitarian response, health metrics and impact assessments, amongst others. The output datasets depict population counts and densities for multiple years per 100x100m grid cells for individual countries, and per 1x1km grid cells for continents. The figure below shows two example outputs.
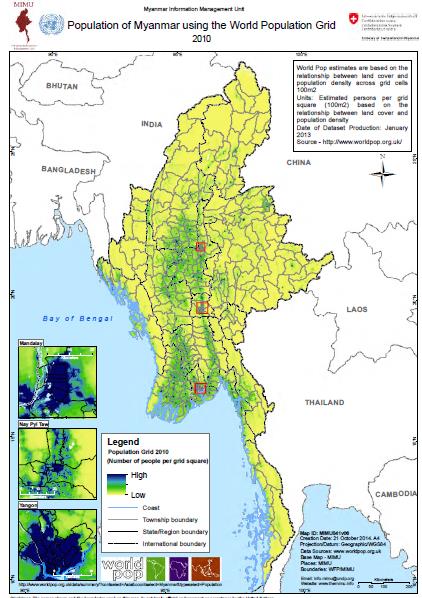
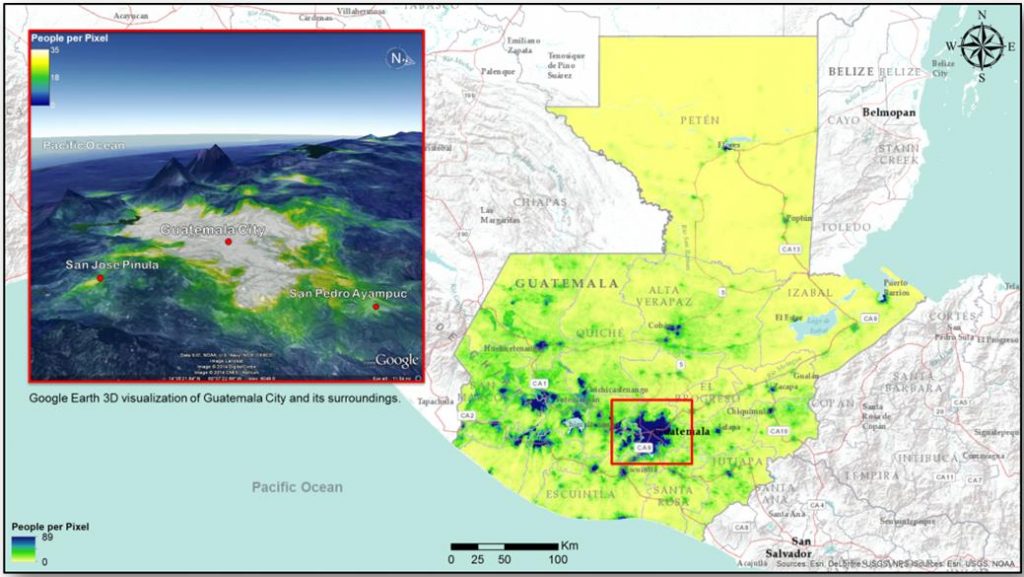
Example WorldPop population distribution map outputs: (Top) Myanmar population density per 100x100m grid cell in 2010 created for the United Nations Myanmar Information Management Unit; (Bottom) Guatemala population density per 100x100m grid cell in 2015 constructed for the World Bank. All WorldPop datasets are freely available here.
In some countries, contemporary and reliable census data are lacking, and so WorldPop are currently collaborating with the Bill and Melinda Gates Foundation, Oak Ridge National Laboratories and the UNFPA to develop methods for ‘bottom-up’ population distribution mapping. Here, methods for extracting human settlement patterns and buildings from very high resolution satellite imagery are used in combination with microcensus data collected in the field to transform satellite feature extractions into high resolution population distribution estimates in the absence of national census data. Work is ongoing, but initial outputs are being used in Nigeria’s vaccination tracking system.
Population change
The approaches outlined above provide static snapshots of population distributions at certain timepoints. Human populations are highly dynamic however, and to complement short term dynamic population distribution methods, WorldPop is developing methods for the high resolution mapping of historical and future population change over decadal timescales. Here, census data from multiple timepoints are integrated with satellite and other spatial datasets from corresponding time periods. Example applications include collaboration with the World Bank on their recent East Asia’s Changing Urban Landscape report and collaboration with the China CDC on high resolution population distribution mapping over the 1990-2015 period (see figure below).
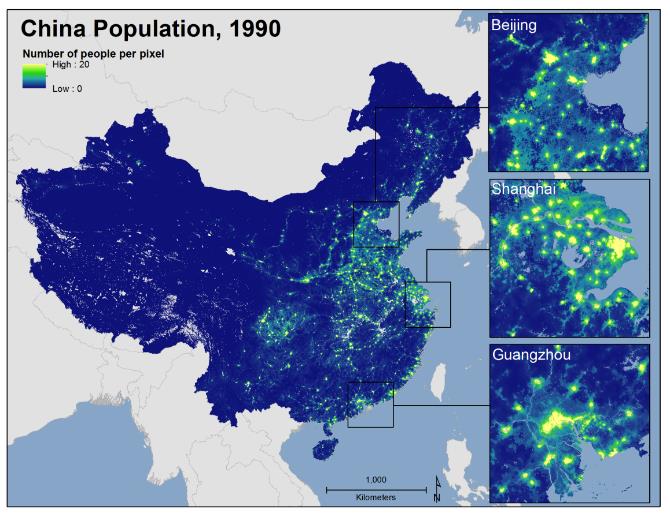
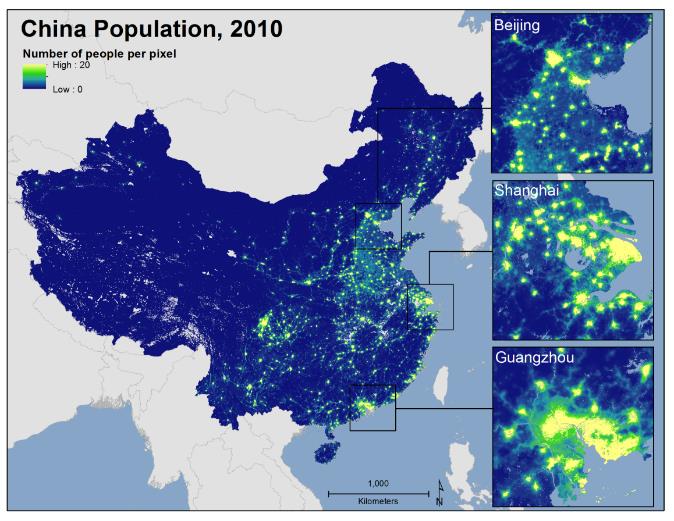
WorldPop population change mapping for China, showing predicted population density for each 100m x 100m grid square for (left) 1990 and (right) 2010.
In addition to this historical population mapping, WorldPop is developing methods for the spatiotemporal prediction of future population distributions, using urban spatial growth models as part of the Modelling and forecasting African Urban Population Patterns for vulnerability and health assessments (MAUPP) project funded by BELSPO.
The accuracy of existing population distribution datasets is limited within African urban areas and urban sprawl is currently not taken into account in population projections. We are developing a high-resolution, generalizable urban expansion model using built-up density layers for 48 African cities and 5 different time periods (1995, 2000, 2005, 2010 and 2015). In contrast to a discrete model (typically urban/non-urban; 0 or 1), the state of a cell takes continuous values, ranging from 0 to 1, to represent the transition between non-urban to urban. Random Forest (RF) models are used to calculate a probability of rural to urban conversion for each non-urban 30m pixel based on a set a covariates such as the accessibility, the topography, or the proportion of urban pixels in the neighbourhood. Cross-validation techniques are used to calibrate and validate the model. Example outputs are shown in the figure below.
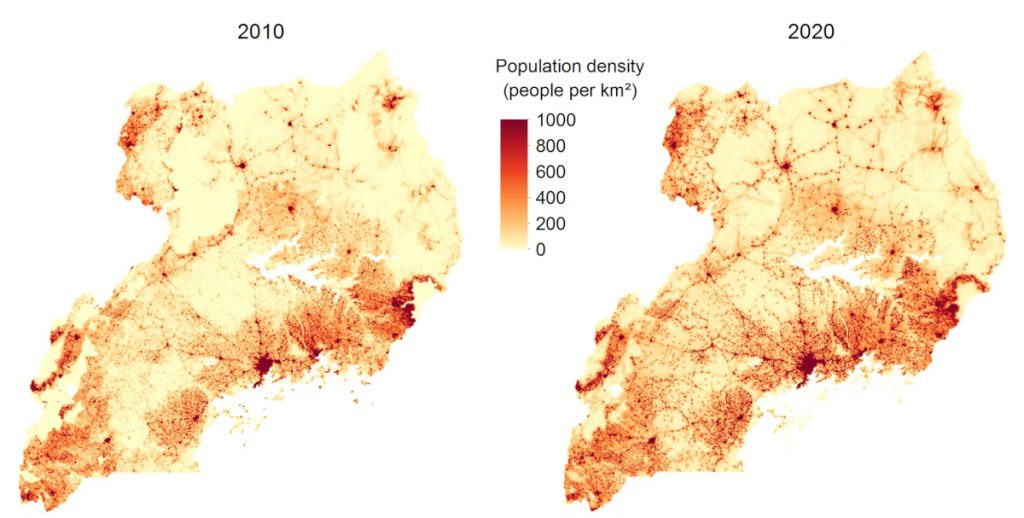
Example of ongoing analyses of predicted population change modelling for Uganda incorporating urban spatial growth models, showing predicted population density in (left) 2010 and (right) 2020.
Mapping population pyramids
The age-group composition of populations varies considerably across the world, and obtaining accurate, spatially detailed estimates about key groups, such as numbers of children under 5 years is important in designing vaccination strategies, educational planning or maternal healthcare delivery, for example. In addition to the high resolution mapping of total population counts and densities, WorldPop works to produce similar outputs broken down by age and sex to provide detailed spatial mapping of population pyramids. The construction of spatially detailed databases of boundary-matched census data (outlined above) enables construction of such mapped outputs. Further details are provided here.
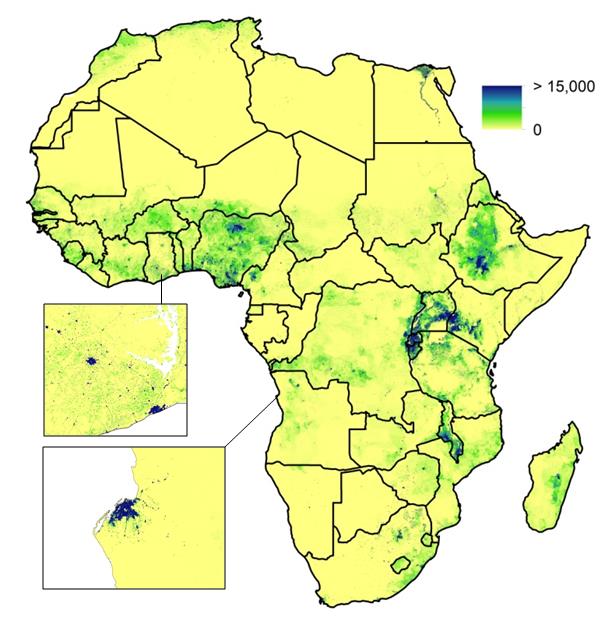
Just as is the case for population counts, in some countries, contemporary and reliable census data are unavailable for supporting detailed mapping of population pyramids. WorldPop have therefore developed methods for the production of high resolution age-structure mapping from geolocated household survey data, together with full quantification of model uncertainty. The figure below shows an example for Nigeria.
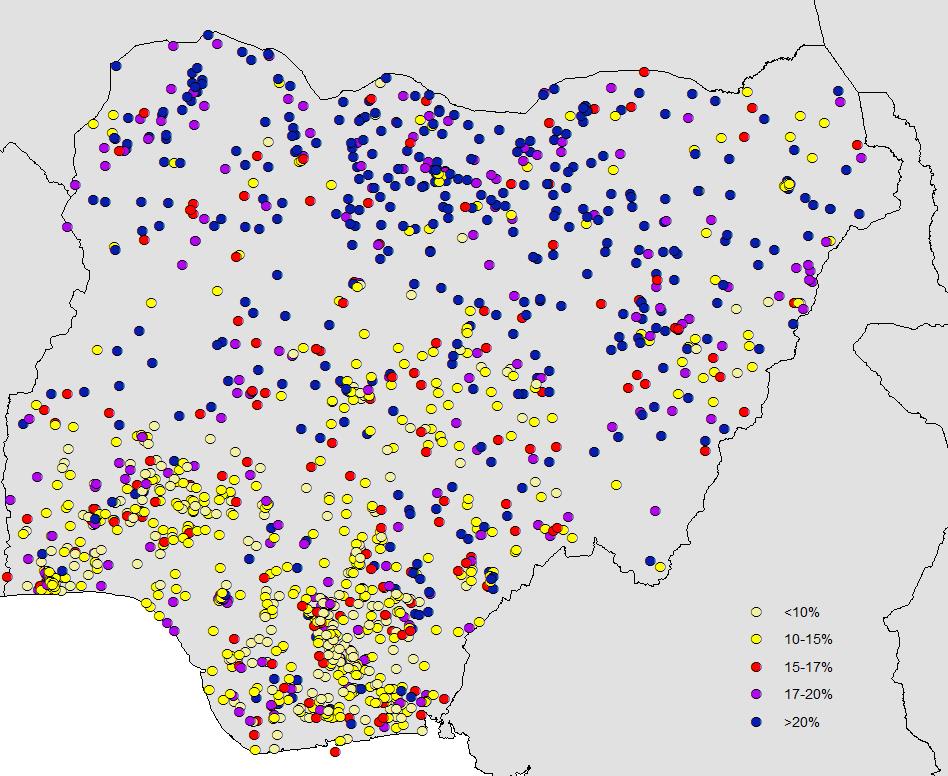
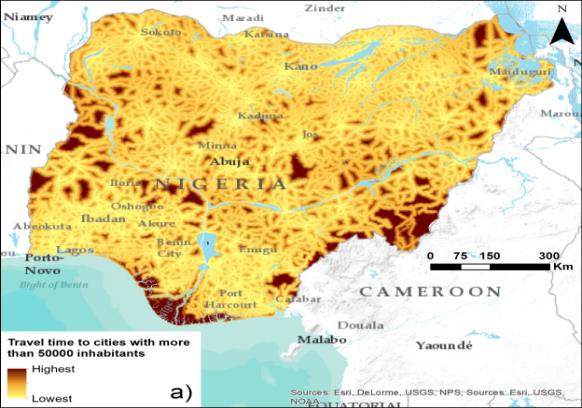
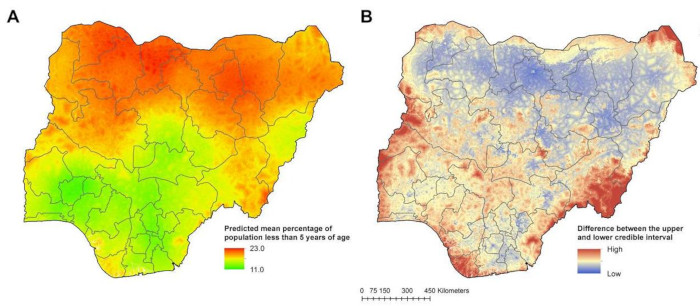
WorldPop high resolution mapping of population age structures in the absence of census data: (top-left) geolocated household survey cluster data coloured by the proportion of the population surveyed that was under 5 years of age; (top-right) example of one of the geospatial covariate layers shown to be strongly correlated with population age-structures, travel time to the nearest large settlement; (bottom-left) predicted proportion of the population under 5 years of age per 1x1km grid square using model-based geostatistics in a Bayesian framework; (bottom-right) map of per grid square uncertainty measure showing the level of confidence in each prediction made in the under 5yr proportion map.
Intra-urban population mapping
The population of Africa is predicted to double over the next 40 years, driving exceptionally high urban expansion rates. Existing population distribution data for urban areas in low and middle-income regions is often limited by (i) a lack of spatially detailed data to capture within-urban heterogeneities, (ii) a lack of multi-temporal data to support improved understanding and forecasting of urban growth. Both of these limitations can be significantly improved with advanced remote sensing data and techniques. Through collaboration with the Modelling and forecasting African Urban Population Patterns for vulnerability and health assessments (MAUPP) project, WorldPop is working toward improved spatial understanding and forecasting of urbanization and urban population distributions in Africa. The performance of urban expansion models have thus far been limited by the quality and type of data available, reducing the confidence and the applications of models for Africa. Through the use of high resolution and very high resolution remote sensing data and spatial modelling, we develop methods to predict urban expansion at moderate spatial resolution, improve understanding and prediction of intra-urban variations in human population density, and integrate results into human population distribution models and forecasts.