A primary focus of WorldPop is ensuring that the methods developed and resulting output datasets undergo academic peer review. Therefore, to keep up with the latest methods, we recommend visiting our publications page. The methods outlined below are becoming outdated and have been superseded in some places – we are working to update these based on newly published papers.
Mapping poverty
The Millennium Development Goals (MDGs) established global poverty eradication as a central focus of the international community. In the new Sustainable Development Goals (SDGs) era, targets for poverty eradication are being designed, with an increasing focus on subnational measurement of progress. Poverty mapping is a valuable approach for effectively characterizing sub national and multi-national disparities in the distribution of poverty. By providing a detailed description of the spatial distribution of poverty and inequality, poverty maps have the potential to play a key role in highlighting inequalities and providing a tool for crafting more effective policies aimed at targeting poverty interventions at detailed levels of spatial disaggregation. Previous approaches to poverty mapping have typically been based on census data, providing difficulties in terms of access to detailed and contemporary data that can be updated regularly, and limiting the ability to provide high resolution, up-to-date poverty maps.
Geolocated household surveys and high resolution satellite data
The WorldPop project, in collaboration with researchers at the University of Oxford’s Malaria Atlas Project, and the Bill and Melinda Gates Foundation’s Financial Services for the Poor Team, have developed and applied novel approaches to poverty mapping built on geolocated household survey data. Full details of the methodologies used to construct the datasets depicting estimates of the proportion of the population living in poverty in each grid cell are available in this report. In brief, geolocated national household survey data were obtained through either the Demographic and Health Surveys (DHS) program or the Living Standards Measurement Study (LSMS) program and either $1.25 and $2 a day consumption-based poverty metrics or the Multidimensional Poverty Index (MPI) were calculated for each survey cluster. A Bayesian geostatistical modelling framework, following approaches constructed for the Malaria Atlas Project was then established to exploit spatiotemporal relationships within the data, leverage ancillary information from an extensive set of covariates, and rigorously handle uncertainties at all stages to generate output surfaces with accompanying confidence intervals. The figures below show example outputs for Nigeria, and further outputs can be found here.
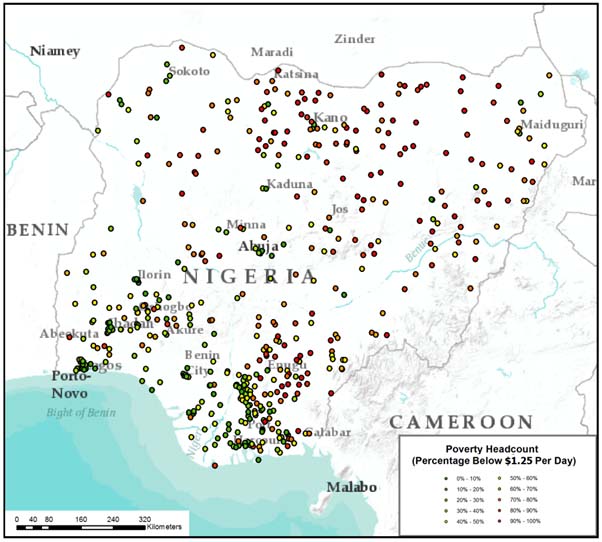
Geolocated household survey clusters from the 2011 Living Standards Measurement Survey (LSMS) showing the proportion of people below the $1.25 a day poverty line
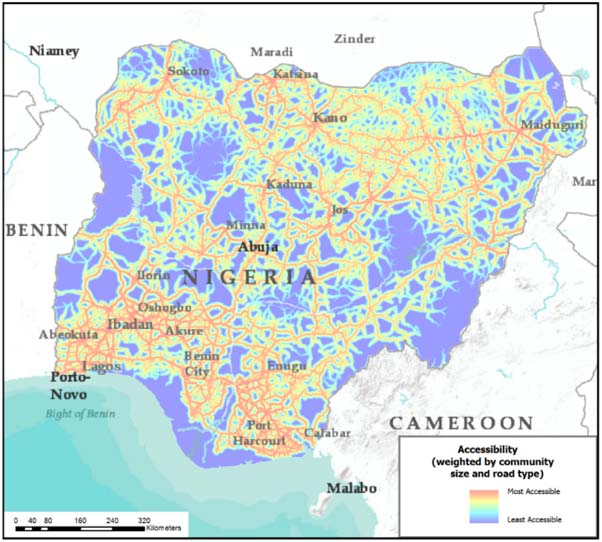
Example geospatial covariate layer showing an index of ‘accessibility’ measured through estimated travel time to the nearest large settlement
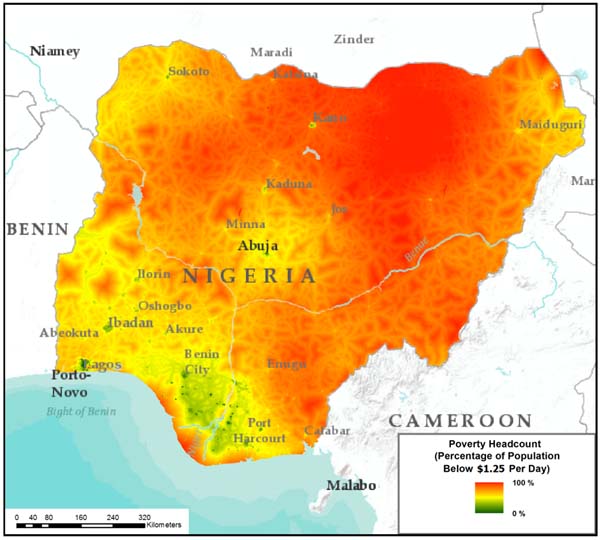
Output poverty map showing predicted proportion of people below the $1.25 a day poverty line per 1x1km grid cell, available to download here
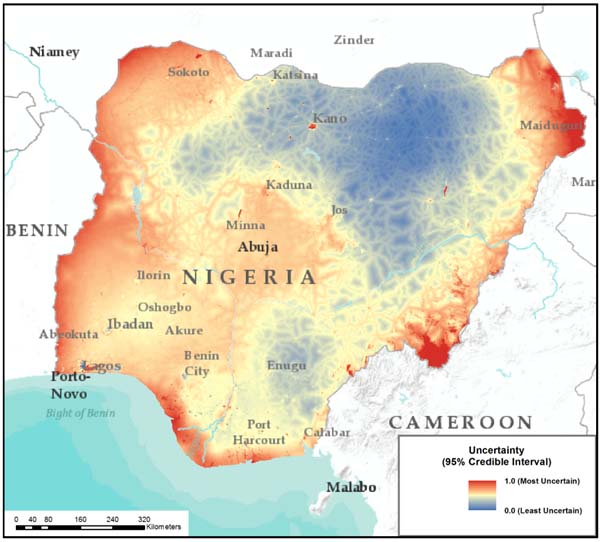
Measurement of per-grid cell mapping uncertainty, available to download here.
These maps were used as the basis for the Bill and Melinda Gates Foundation’s FSP maps tool, supporting governments in tracking progress against National Financial Inclusion Strategies and making evidence-based decisions. The approach is applicable for asset-based indices (e.g. Multidimensional Poverty Index, DHS wealth index) and consumption measures (e.g. <$2 a day) and recent analyses has shown value also for rapid measurement tools (e.g. Progress out of Poverty Index).
WorldPop continues to collaborate with a range of Financial Service Providers, the Bill and Melinda Gates Foundation and the Grameen Foundation on meeting the needs of governments and other stakeholders in undertaking and scaling up such high resolution poverty mapping. However, while such survey and satellite mapping overcomes some of the problems associated with census-based poverty mapping, a number of challenges remain, such as (i) a lack of mapping detail within urban areas, (ii) difficulties in updating these maps in the absence of new survey or census data, and (iii) substantial variation in poverty rates still remaining uncaptured by the approach.
Integrating mobile network data
With funding from the Bill and Melinda Gates Foundation, and in collaboration with the Flowminder Foundation, researchers at the University of Washington and multiple mobile network operators, the WorldPop project is working on overcoming the drawbacks of the satellite-based approach through the use of anonimised mobile phone network data. Anonimised data on mobile calling patterns, phone user mobility and credit top ups amounts and frequencies have been shown in a range of studies to correlate strongly with income and poverty metrics. Moreover, such data are produced in near real-time and are spatially detailed in urban areas (see figure below), providing valuable and complimentary additions to the mapping approach outlined above.
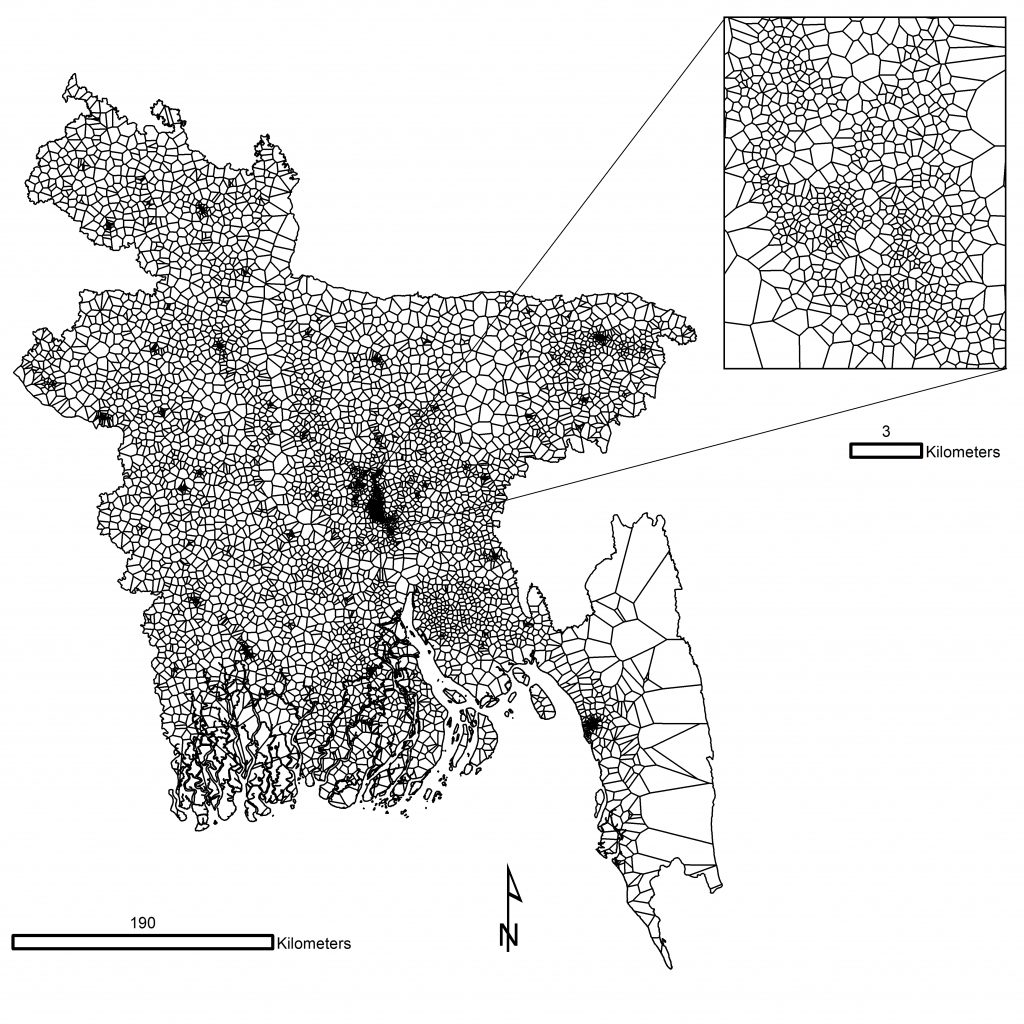
Spatial structure of mobile phone tower configuration in Bangladesh. The zoom window shows the spatial detail of Dhaka, where a high number of mobile towers enable the estimation of important within-city variations.
Results from Bangladesh provide the first research outputs produced by combining anonymised data from mobile phones and satellite imagery data to create high resolution maps of poverty. The results demonstrate that models integrating these data sources provide improvement in predictive power and lower error. These results are promising as the CDR data here produce accurate, high-resolution estimates in urban areas not possible using RS data alone. This research is now expanding to other countries and Bangladesh outputs can be downloaded here.