Dynamic denominators – mapping seasonal disease incidence and demands on health facilities
Project leads: Andy Tatem, Elisabeth zu Erbach-Schoenberg
Collaborators/funders: Namibia National Vector Borne Disease Control Program, MTC Namibia, Bill and Melinda Gates Foundation, Clinton Health Access Initiative
Any efforts of reducing disease burden, whether focussed on a particular country or worldwide, rely on accurate health metrics being available. Up to date data is crucial for measuring progress towards goals, such as the elimination of a disease in a particular country or reduction of global disease burden in the context of international efforts such as the Sustainable Development Goals. Information on disease distribution and location of hotspots is also crucial for informing policy and operational decisions on resource allocation, ranging from health facility locations and budgets to distribution of medical supplies and planning of interventions.
In many settings, data is collected as case counts through passive surveillance systems. To transform the collected case counts to incidence measures, accurate estimates of the underlying population numbers are needed as a denominator. Generally, census numbers are used for this. However, censuses are conducted infrequently and provide therefore only a snapshot of the population distribution at a particular time. In reality, populations are highly mobile and large-scale seasonal population movements have been observed for many countries. These movements lead to seasonal changes in population density, meaning using static, census-derived denominators is likely to bias incidence estimates.
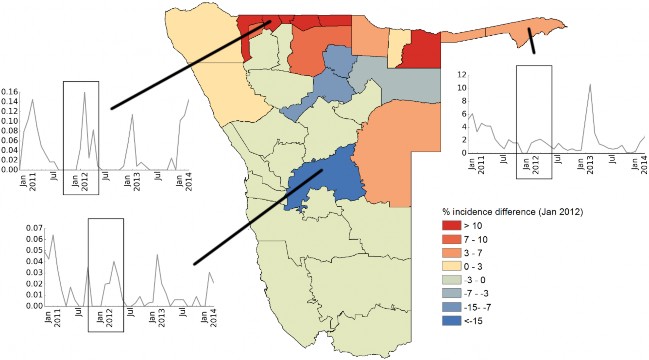
Mobile phone data can be used to quantify these seasonal changes in population distribution and provide updated and dynamic denominators to be used for calculating district-level disease incidence. In addition to improving incidence estimates, awareness of seasonal movements has the potential to increase the impact of interventions, such as vaccination campaigns or distributions of commodities like bednets.
Fig 1: Difference in malaria incidence in Namibia for January 2012, when switching from static to dynamic denominators. Inset figures show incidence estimates over time using dynamic denominators for select health districts